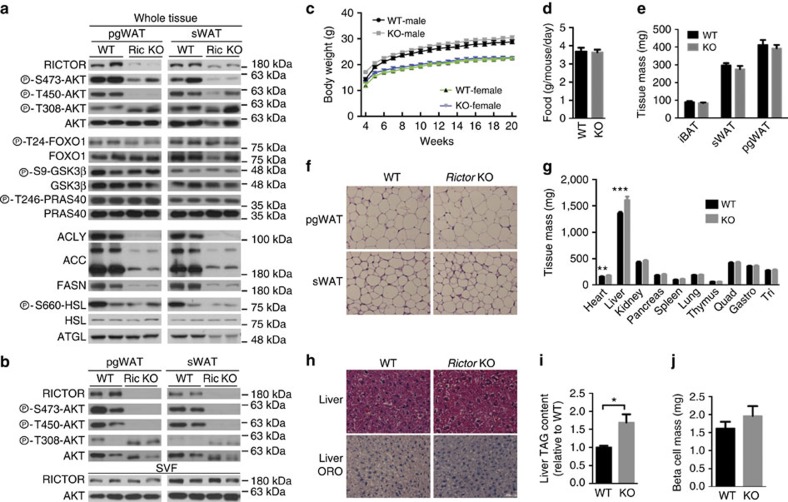
Figure 1. Growth characteristics of mice lacking Rictor in adipose tissue.
(a) Western blots of the indicated total and phosphor-proteins in whole-fat tissue lysates of Rictorfl/fl (WT) and RictorAdipoq-Cre (KO) mice. (b) Western blots using lysates of purified adipocytes and the stromal vascular faction (SVF) prepared from pgWAT and sWAT. (c) Body growth curves. n=8. (d) Food consumption. n=6. (e) Individual fat tissue mass analysis. n=8–13. (f) Representative H&E images of pgWAT and sWAT. (g) Individual lean tissue mass analysis. n=8–13. (h) Representative H&E images of liver and of liver Oil Red O staining. (i) Liver TAG content. N=6. (j) β-cell mass. N=5. Data were analysed by Student's t-test. Values are expressed as mean+s.e.m. *P<0.05; **P<0.01; ***P<0.001. Scale bar, 100 μM. H&E, haematoxylin and eosin.

