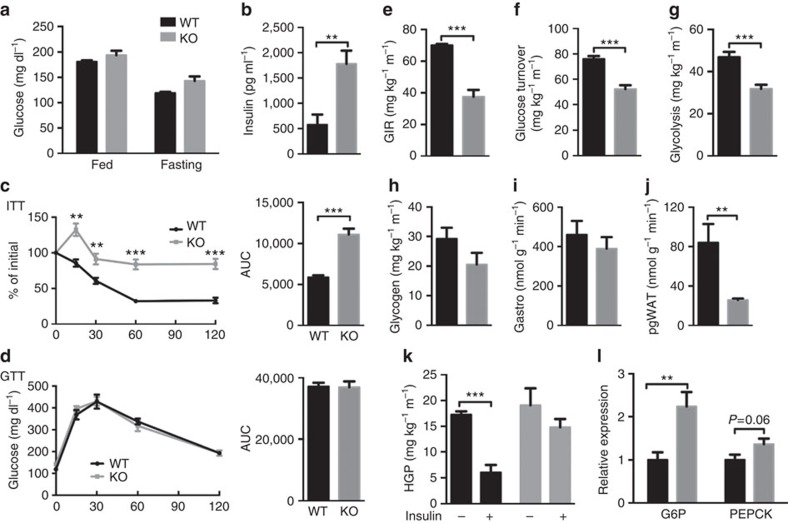
Figure 2. Deleting Rictor in fat impairs HGP.
(a) Plasma glucose level in random fed and 6 h fasted Rictorfl/fl (WT) and RictorAdipoq-Cre (KO) mice. n=6 or 8. (b) Plasma insulin level in random fed mice. n=6. (c) Insulin tolerance test results with area under the curve to the right (ITT). n=6 or 8 mice. (d) Glucose tolerance test results with area under the curve to the right (GTT). n=6 or 8 mice. (e-l) Whole-body glucose homeostasis in 8-10 weeks old male mice was evaluated by hyperinsulinemic-euglycemic clamp (n=5 or 6 per group). (e) GIR. (f) Glucose turnover rate. (g) Whole-body glycolysis. (h) Whole-body glycogen synthesis. (i) Glucose uptake in skeletal muscle (gastro). (j) Glucose uptake in adipose tissue (pgWAT). (k) HGP without or with insulin stimulation. (l) Relative hepatic mRNA expression of the indicated gluconeogenic genes. N=8. Data were analysed by Student's t-test. Values are expressed as mean+s.e.m. *P<0.05; **P<0.01; ***P<0.001. ITT, insulin tolerance test. GIR, glucose infusion rate. GTT, glucose tolerance test.

