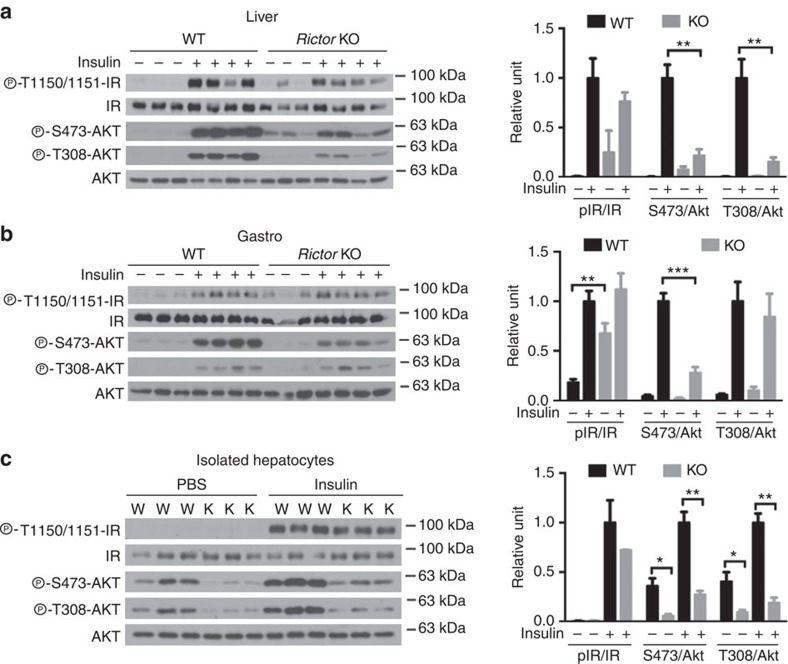
Figure 4. Insulin action in liver and muscle.
(a,b) Western blots of the indicated total and phospho-proteins in whole tissue lysates prepared from liver (a) and skeletal muscle (b). Male Rictorfl/fl (WT) and RictorAdipoq-Cre (KO) mice (8–10 weeks old) were fasted for 6 h and then injected with insulin (0.75 U kg−1) for 15 min before collecting samples. (c) Western blots of the indicated total and phospho-proteins in isolated hepatocytes. In each panel, the Western blot quantifications are shown to the right. n=3 or 4. Values are expressed as mean+s.e.m. *P<0.05; **P<0.01; ***P<0.001.

