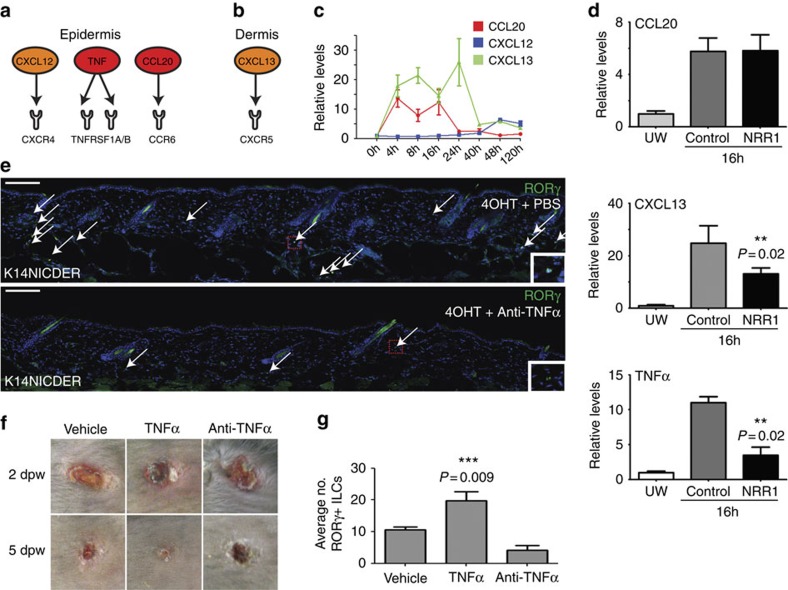
Figure 5. Notch1 drives expression of TNFα that regulates ILC3 localization in wounds.
(a,b) Factors upregulated by Notch in the (a) epidermis and (b) dermis that can interact with receptors expressed on RORγ+ ILCs. (c) mRNA levels of CCL20, CXCL12 and CXCL13 quantified by qPCR in unwounded and wounded back skin 4, 8, 16, 24, 40, 48 and 120 hrs post wounding. (d) qPCR quantitation of CCL20, CXCL13 and TNFα mRNA in unwounded or wounded mice injected with NRR1 blocking antibodies or control IgG antibodies for 7 days before wounding and analysed 16 hrs after wounding. Graph bars represent mean of biological replicates (n=3). (e) Back skin sections of K14NICDER transgenic mice injected i.p. with PBS or TNFα blocking antibody for 7 days followed by 2 days of 4OHT-treatment labelled with antibodies to RORγ (green) and DAPI counterstained. Embedded insets are higher magnification images of the boxed region in the accompanying panel. (f) Punch wounds treated with PBS (vehicle), TNFα or TNFα blocking antibody (anti-TNFα) photographed at 2 and 5 dpw. Note red, inflamed tissues evident adjacent to TNFα-treated wounds 2 dpw. Experiment repeated twice (total animal numbers n=4 control; n=7 TNFα blocking antibody; n=8 TNFα). (g) Quantification of dermal RORγ+ cells in wounded mice 2 dpw treated with vehicle, TNFα or TNFα blocking antibody (n=3 control; n=5 TNFα; n=5 TNFα antagonist; sample number=biological replicates; quantified area <1,600 micrometres distal to wound site). All panels: white arrows mark RORγ+ cells. Error bars on graphs represent standard error of the mean (s.e.m.). Scale bars equal 100 microns. Results statistically significant as determined by Student's t-test (d,g) marked with ** or ***; P-values included on graphs.

