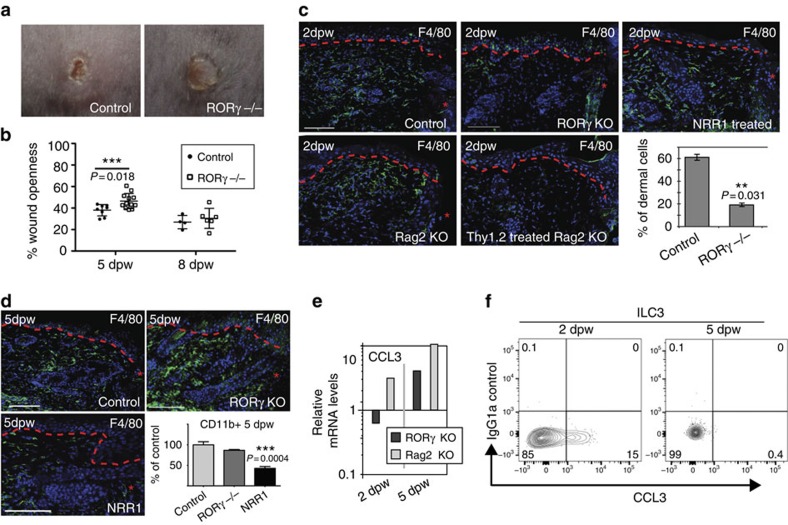
Figure 7. Notch-recruited ILC3s orchestrate macrophage entry and wound closure through production of CCL3.
(a,b) 4 mm punch-wounded RORγ+/− (control) and RORγ−/−. (b) Quantitative analysis using 3D imaging; wound openness is measured in control and RORγ−/− wounds at 5 dpw and 8 dpw. The mean openness of RORγ−/− wounds is significantly greater than that of wildtype mice at 5 dpw (n=12 RORγ−/−; n=8 control) but not 8 dpw (n=6 RORγ−/−; n=4 control) (F=6.721; df=18; P=0.018). (c,d) Sections of wounded RORγ−/− (RORγ KO), RORγ+/−/Rag2−/− (Rag2 KO), RORγ+/-/Rag2−/− injected with anti-Thy1.2 antibodies (Thy1.2 treated Rag2 KO), wildtype mice treated with NRR1 blocking antibodies (NRR1 treated) and/or wildtype control tissues collected 2 dpw (c) or 5 dpw (d) stained with antibodies to F4/80 (green) and DAPI counterstained (blue). Graph shows percentage of F4/80+ dermal cells quantified by cell counting on sections in control verses RORγ−/−mice 2 dpw. (d, bottom right panel). Flow cytometry analysis of single cell suspensions from parallel wounding experiments analysed 5 dpw. Cells stained with CD45 and CD11b prior to analysis (n=3 for each genotype/time point) and the relative number of CD45+CD11b+ cells was determined. Results were normalized (designated 100%) to controls from skin collected 5 dpw. (e) mRNA was isolated from unwounded controls (n=3) and punch-wounded RORγ−/− (RORγ KO; n=3) or Rag2−/− (Rag2 KO; n=3) skin collected 2 dpw or 5 dpw. Relative mRNA levels of CCL3 were quantified by qPCR. mRNA levels were normalized to wildtype skin 2 dpw (designated 1). Data plotted on a log scale; 3 biological replicates. (f) CCL3 production in PMA/ionomycin stimulated ILC3s quantitated by flow cytometry 2 and 5 dpw. Red, dashed line (c,d) marks epidermal–dermal boundary; single asterisks mark wound site; dpw=days post wounding; graph bars=mean and error bars=standard error of the mean (s.e.m.); scale bars=100 microns. Results statistically significant as determined by linear mixed effects model (b) or Student's t-test (c,d) marked with ** or ***; P-values included on graphs.

