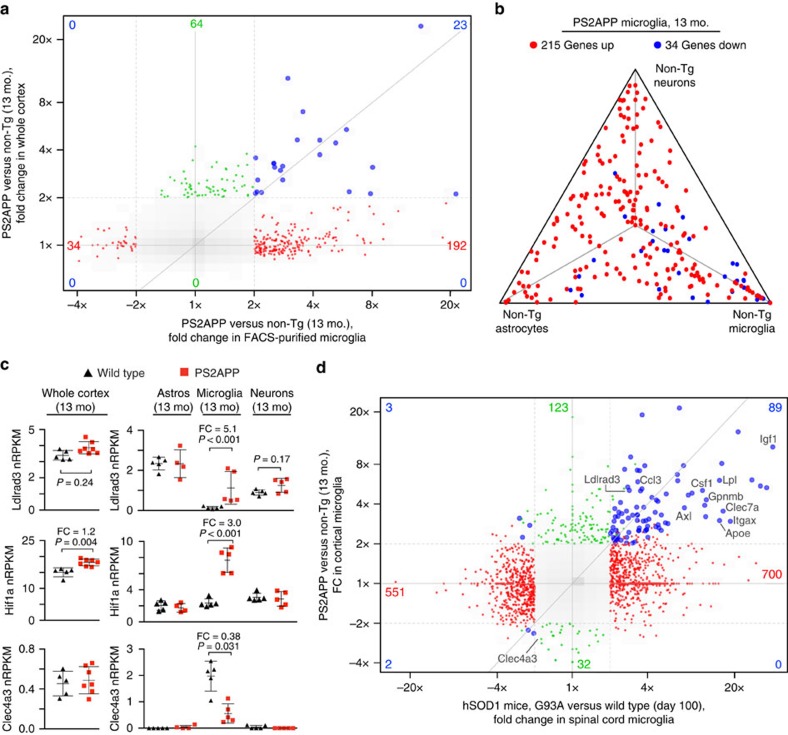
Figure 10. Analysis of amyloid-driven changes in microglial gene expression.
(a) Genome-wide ‘four-way' plot comparing differential gene expression (fold change (FC) ⩾2, adjusted P≤0.5) observed in PS2APP whole cortex versus that observed in purified PS2APP microglia (each compared with non-transgenic). Each point represents a single gene, with only genes meeting the cutoffs in either study being plotted. Red, green and blue points met the cutoffs in sorted microglia only, whole cortex only or in both analyses, respectively. Grey indicates the distribution of FC values for all genes. (b) In this triangle plot, the 249 genes differentially expressed in PS2APP microglia (FC ⩾2, adjusted P≤0.05) are plotted to show their degree of preferential expression in neurons, astrocytes or microglia from normal, non-transgenic (non-Tg) cortex. (c) Specific examples of amyloid-driven changes in microglial gene expression that were undetected or muted in whole tissue expression profiles, with FC and adjusted P-values (Wald test, DESeq2; n=5 animals per genotype) shown and bars representing mean±s.d. (Prism). Note: Absolute nRPKM values between whole cortex and sorted cell studies should not be directly compared, because of different library preparation methods. (d) Similar to a, except this ‘four-way' plot compares genes differentially expressed in microglia from PS2APP Alzheimer's model (this study) with those observed in microglia from the hSOD1mut ALS model (GSE43366, imported).

