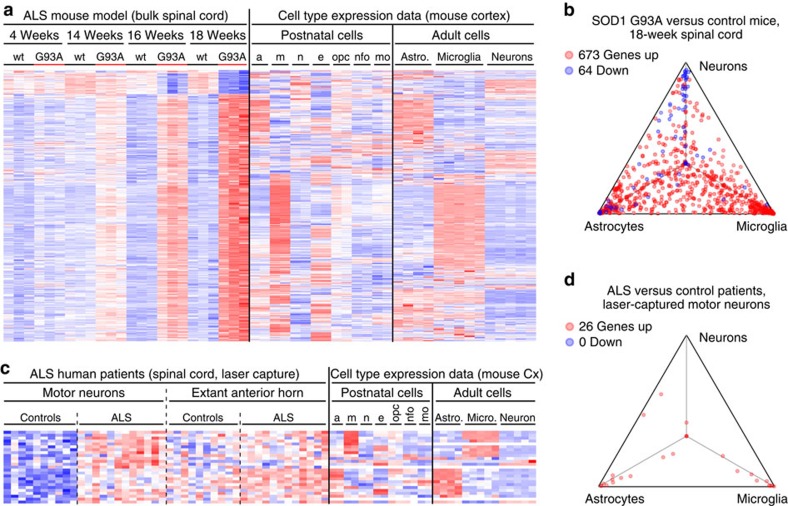
Figure 2. Mapping ALS-related gene expression profiles to CNS cell types.
(a,b) Similar to Fig. 1a,b, this heat map (colour range: −3.34≤Z≤3.68) and triangle plot analyse cell type expression for genes differentially expressed in bulk spinal cords from the SOD1 G93A ALS model versus wild-type mice at 18 weeks of age (GSE18597, imported). (c,d) Similar to Fig. 1a,b, this heat map (colour range: −2.75≤Z≤3.14) and triangle plot analyse cell type expression for genes differentially expressed in laser-captured motor neuron samples from ALS patient spinal cords versus controls (GSE18920, imported). Expression data from anterior horn material remaining after motor neuron excision are also shown. a/astro., astrocytes; Cx, cortex; e, endothelial cells; m/micro., microglia; mo, myelinating oligodendrocytes; n, neurons; nfo, newly formed oligodendrocytes; opc, oligodendrocyte progenitor cells; wt, wild type.

