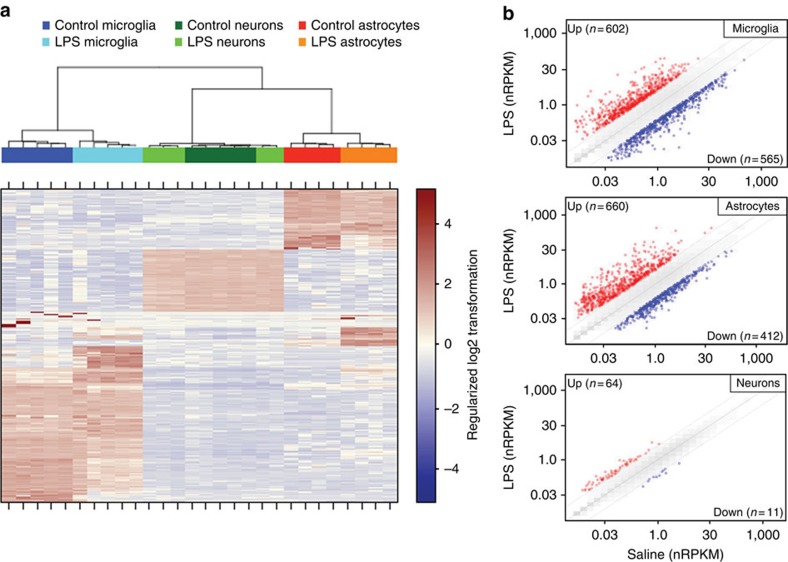
Figure 5. Genome-wide, cell type-specific expression profiles of the brain's endotoxic transcriptional response.
(a) We performed unsupervised clustering of sorted brain cell RNA-Seq data from saline- and LPS-injected mice (n=5 animals per treatment) using the 2.5% most variably expressed genes across all samples. The samples segregated into distinct clusters determined primarily by lineage and cell type. Microglia and astrocyte samples further segregated according to treatment. (One astrocyte sample from each group was excluded from the analysis due to evidence of neuronal contamination.) (b) Genome-wide ‘two-way' plots of average gene expression levels in microglia, astrocytes or neurons isolated from LPS-injected versus saline-injected mice. Genes whose average expression increased (red) or decreased (blue) at least fourfold (adjusted P≤0.05, Wald test, DESeq2) are plotted.

