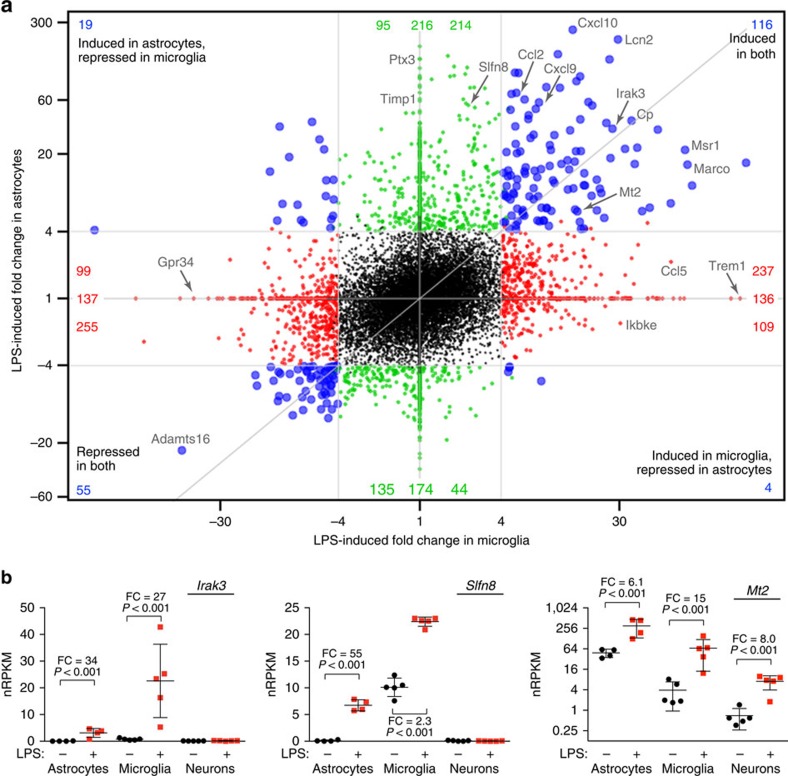
Figure 6. Distinct transcriptional responses to endotoxemia in microglia and astrocytes.
(a) Genome-wide ‘four-way' plot for every gene's LPS-induced fold change (FC) in astrocyte expression versus LPS-induced FC in microglial expression. Each coloured dot represents a gene that met the cutoffs of FC⩾4, adjusted P≤0.05 in microglia only (red), in astrocytes only (green) or in both cell types (blue). Higher induction in terms of FC should not be conflated with absolute expression levels (see examples in b). Genes below an expression threshold (see the Methods for details) in a cell type are plotted as FC=1 for that cell type. (b) Individual expression plots of RNA-Seq data for Irak3, Slfn8 and Mt2 genes in each cell type from saline- and LPS-injected mice (n=5 animals per treatment), with FC and adjusted P-values shown (Wald test, DESeq2). Bars represent mean±s.d. (calculated by Prism).

