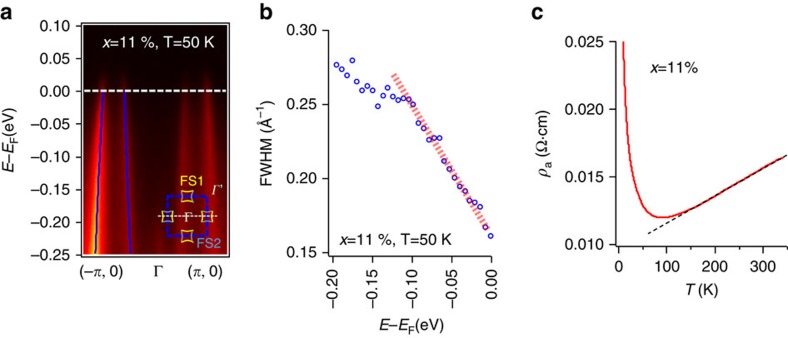
Figure 5. Marginal-Fermi-liquid-like single-electron scattering rates.
(a) The energy-momentum intensity plot along (−π, 0)−Γ−(π, 0) for an x=11% sample at T=50 K, passing through four pieces of FS1 Fermi surface. The peak centroids obtained from double-Lorentzian fittings to the momentum-distribution curves (MDCs) are marked with blue lines. The inset shows where the cut in the main figure is taken from the BZ. (b) The full-width-half-maximum (FWHM) from the double-Lorentzian fitting is plotted versus the binding energy, showing a linear ‘MFL' scattering rate. (c) Resistivity versus temperature for the same sample showing a linear dependence at intermediate temperatures. The black dashed line is a guide to the eye.

