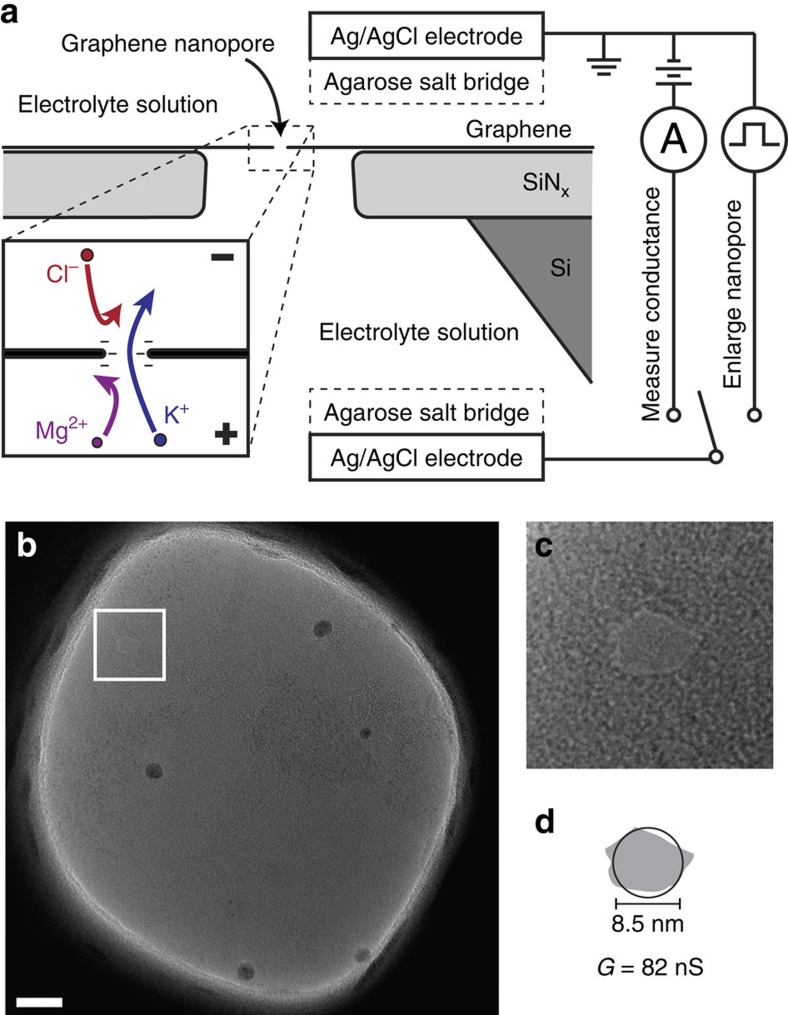
Figure 1. Experimental setup.
(a) Cross-sectional diagram of a suspended graphene nanopore sample immersed in electrolyte solution. Ag/AgCl electrodes that contact the solution via agarose salt bridges are used to measure ionic current through the nanopore or enlarge the nanopore using electrical pulses. Inset shows an illustration of anion and divalent cation rejection in a negatively charged nanopore. (b) TEM image of a suspended graphene membrane after a pore has been created via electrical pulse fabrication. Scale bar, 20 nm. White box indicates the location of the nanopore. (c) Close-up of area containing a nanopore. The sides of the image are 30 nm in length. (d) Comparison of the size of the pore with estimation of the pore size calculated from the pore conductance via equation 1. The grey outline is traced from the TEM image and the black circle is calculated from the conductance G.

