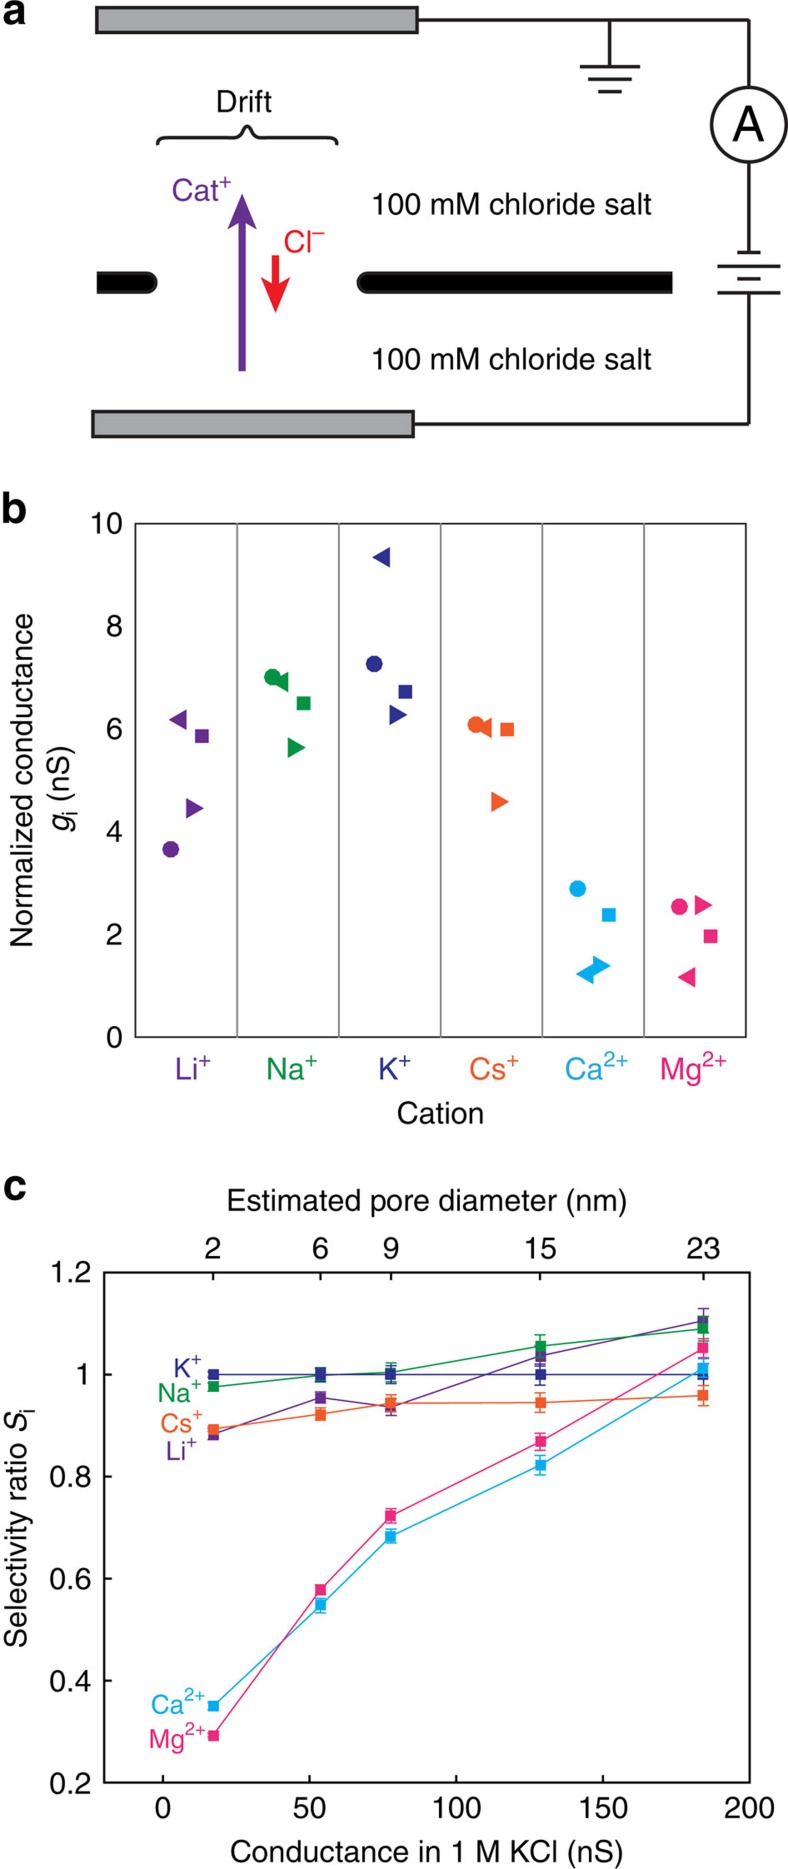
Figure 3. Inter-cation selectivity.
(a) Schematic of experimental setup: pore conductance is measured in a variety of 100 mM cation-chloride solutions. (b) Normalized conductance gi (see equation 3 for definition) for four different nanopores 2–4 nm in diameter; different shaped markers indicate different samples. Data is sorted by cation. Monovalent cations pass more easily than divalent cations. (c) Inter-cation selectivity ratio Si (see equation 4 for definition) of a graphene nanopore as a function of pore size. Error bars indicate the standard deviation. The conductance in 1 M KCl (lower x-axis) is used to estimate pore size using equation 1. Inter-cation selectivity decreases as pore size increases and is no longer significant above 20 nm.

