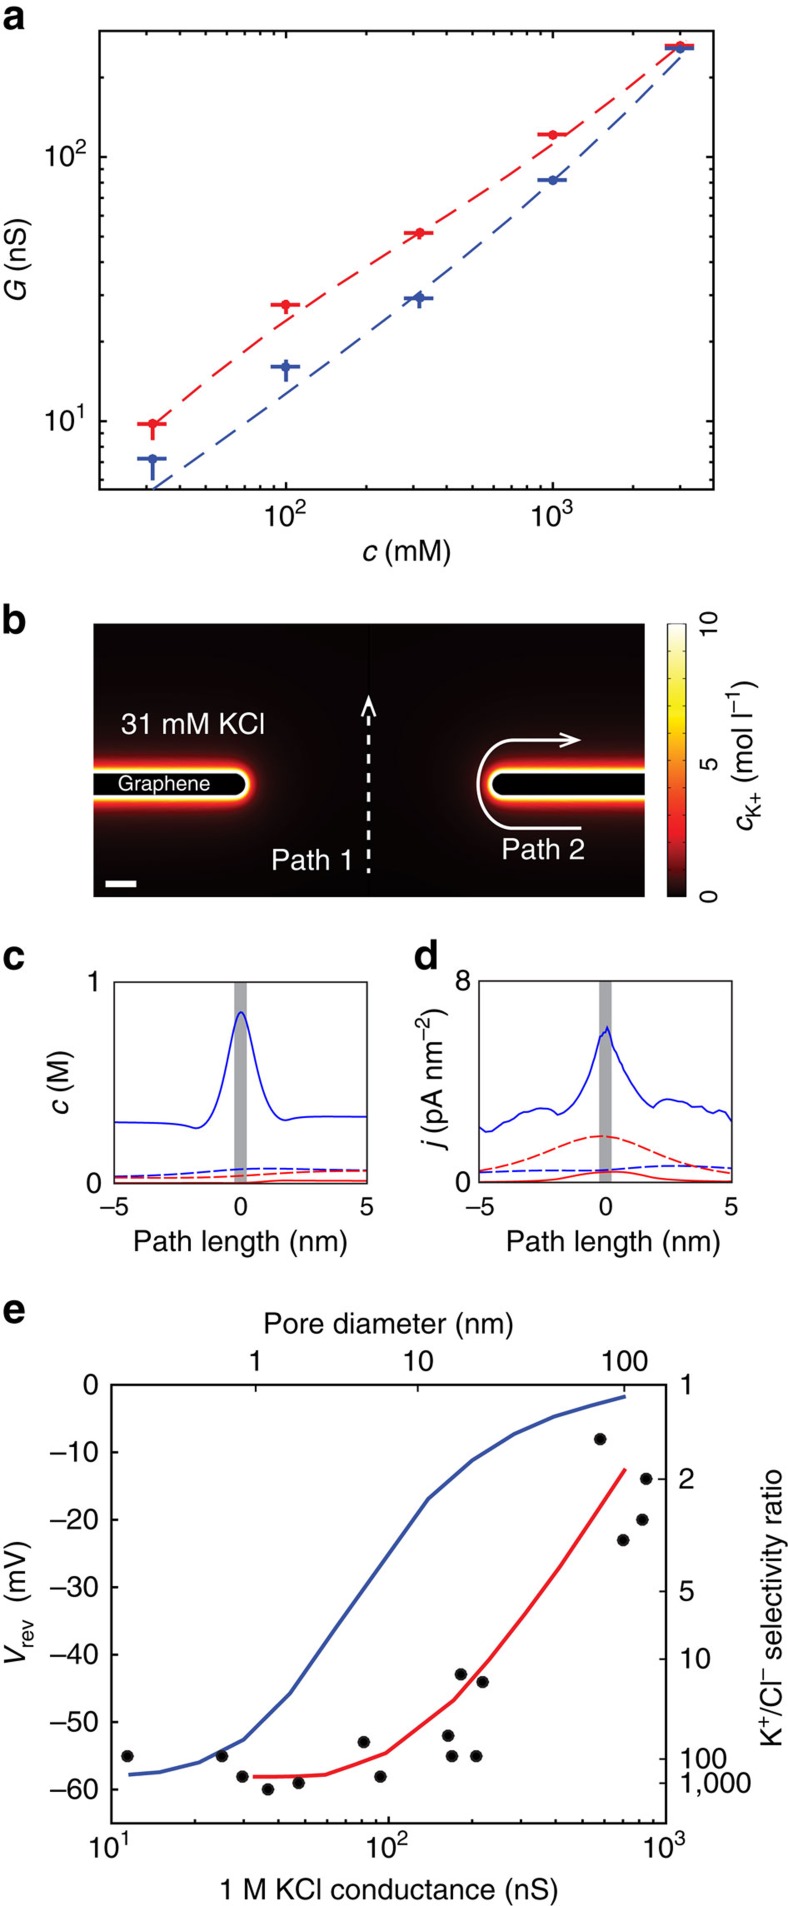
Figure 4. Surface charge model of ion selectivity.
(a) Conductance measurements as a function of KCl concentration for an 8.5 nm pore (the same pore shown in Fig. 1b–d). Blue and red markers show experimental data at pH 2 and pH 8, respectively. Vertical and horizontal error bars indicate standard deviation. Dotted lines show numerical predictions from a numerical PNP model (see Supplementary Fig. 1 for details) with surface charge density of 0 C m−2 (blue) and −0.6 C m−2 (red). (b) Diagram of the numerical PNP system with negative surface charge (σ=−0.6 C m−2). Scale bar, 1 nm. The K+ concentration is plotted in a 31 mM KCl environment with 100 mV applied across the pore. Two illustrative current paths are indicated, path 1 (dotted line) through the centre of the pore and path 2 (solid line) along the membrane surface. (c) K+ (blue) and Cl− (red) concentrations plotted along the two illustrative paths shown in b. The grey bar indicates the thickness of the nanopore. Path 2 along the surface of the graphene has elevated K+ and decreased Cl− concentration. (d) K+ (blue) and Cl− (red) current densities plotted along the two illustrative paths shown in b. Path 2 shows much greater K+ current than Cl− current, which results in K+/Cl− selectivity. The overall pore selectivity results from these highly selective, highly conductive current paths. (e) Comparison of measured reversal potentials (black dots) and numerical predictions from the model with surface charge density of 0 C m−2 (blue line) and −0.6 C m−2 (red line). Both experimental data and numerical predictions are for a 10:100 mM concentration gradient. Right side, y-axis shows selectivity ratios calculated from the reversal potentials.

