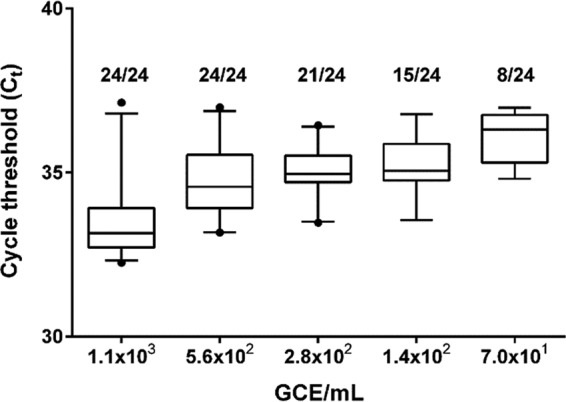
FIG 2.

Limit of detection. The number of positives per total number of replicates tested is given above each box. The mean values are indicated by horizontal lines; boxes denote the 25th to 75th percentiles and whiskers, the 5th to 95th percentiles; dots represent outliers. GCE, genome copy equivalents.
