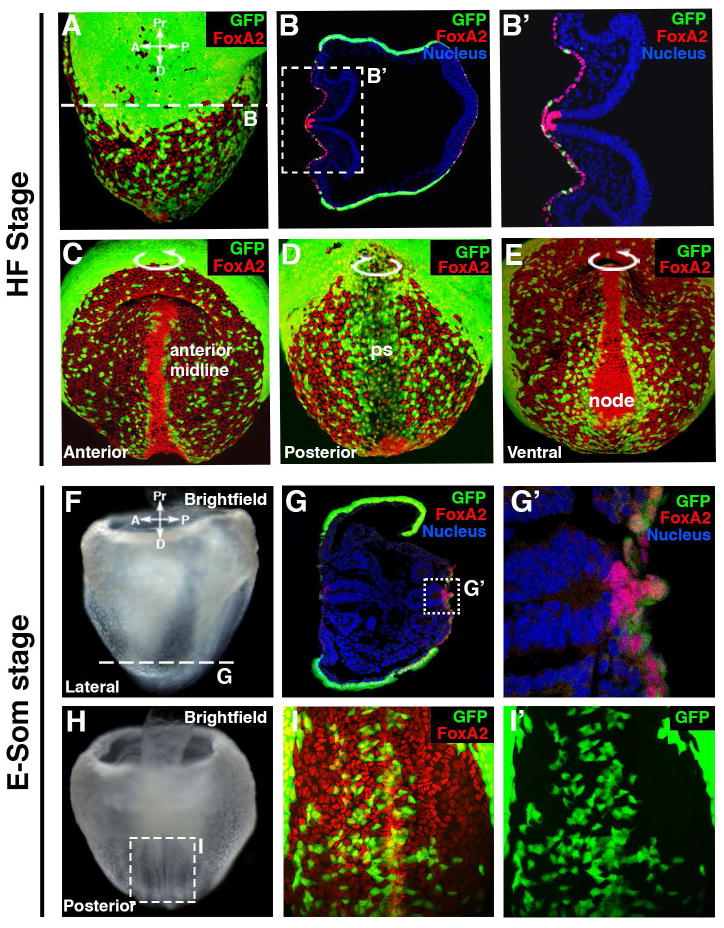
Figure 4. Foxa2 and VE cells distribution during notochord submergence.
A–E: FoxA2 (red) is expressed in the midline, node and gut endoderm of a headfold stage Afp-GFPTG/+ embryo labeling VE cells with GFP. Note the increased cell density and higher levels of FoxA2 expression in the midline and node.
F–I: At early somite (E-Som) stage, FoxA2 (in red) is still expressed in the midline, node and gut endoderm. VE cells are labeled with GFP. Note the FoxA2+ notochordal cells have submerged and VE cells from both side of the midline are now contiguous and recovering the notochordal plate.

