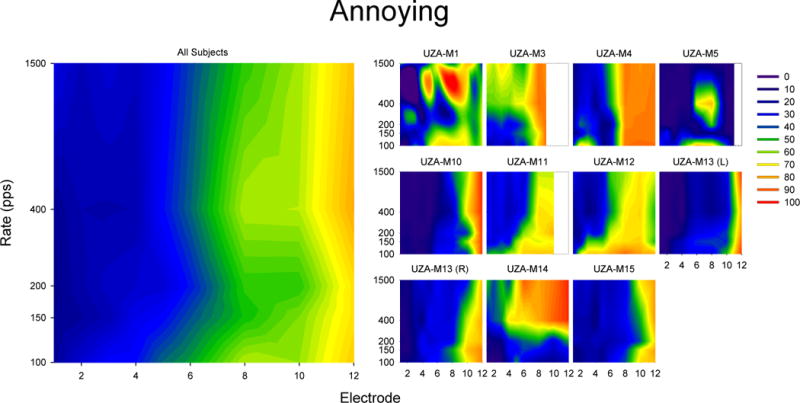
Figure 6.

Results of scaling the term “Annoying” in response to single electrode pulse trains. The smaller plots on the left show 20% trimmed means results for individual subjects while the larger plot on the left show 20% trimmed means of all subjects (including UZA-M13(R) but not UZA-M13(L)). For each plot, the x-axis indicates the electrode number (where 1 is the most apical and 12 is the most basal) and the y-axis indicates the stimulation rate. The colors indicate the degree to which subjects agree that the sound is “Annoying” ranging from blue (indicating the subject reported that the sound was not very annoying) to red (indicating that the subject reported that the sound was very annoying).
