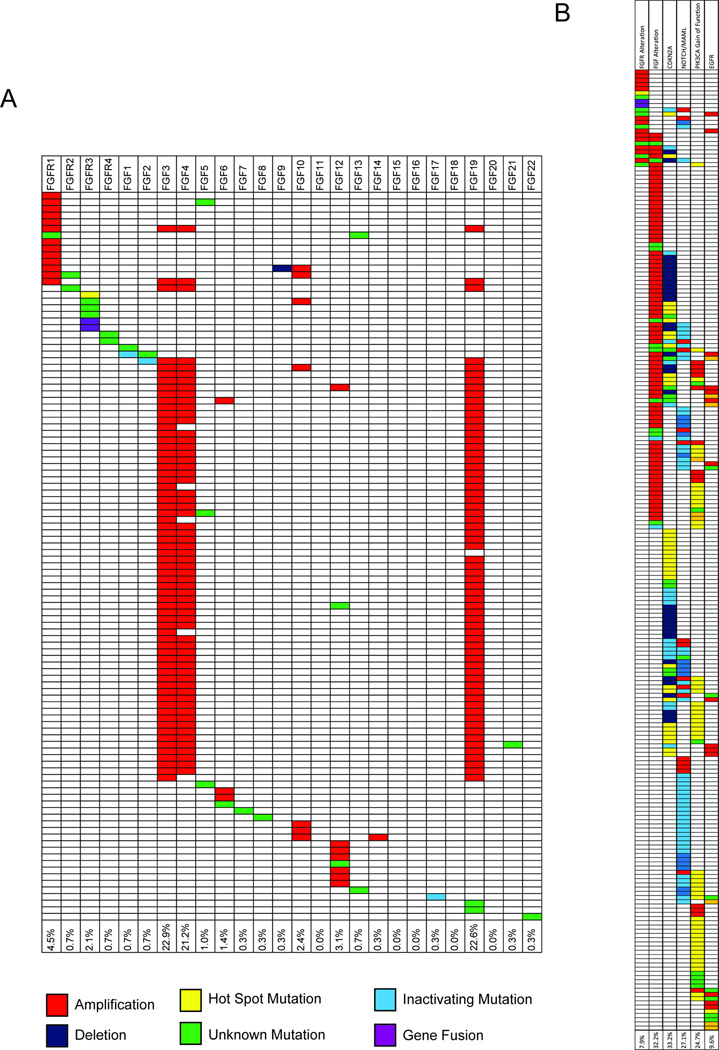
Figure 4. Analysis of genomic aberrations from the TCGA HNSCC data.
Individual patients are shown along the Y-axis and FGF/FGFR genes are shown along the X-axis. Aberrations are indicated by color code. The table demonstrates a high frequency of FGFR1, FGF3, FGF4 and FGF19 aberrations (A). Comparison of trends in patient mutations between FGF/FGFR and other commonly mutated pathways (B).

