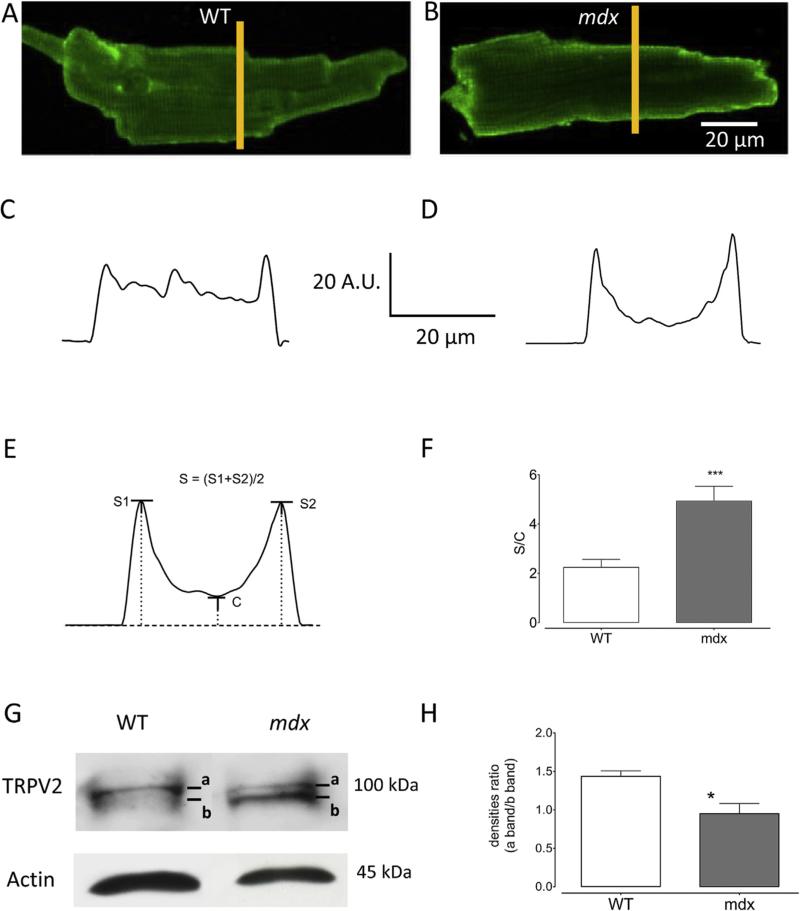
Fig. 4. TRPV2 protein expression in isolated WT and mdx cardiomyocytes.
(A and B) Examples of immunostaining images of TRPV2 channels in WT and mdx cardiomyocytes, respectively. In each image, the drawn vertical yellow line represents the area selected for plotting a fluorescence profile. (C) Fluorescence amplitude profile from WT in (A). (D) Fluorescence amplitude profile from mdx in (B). From several images, quantification of the fluorescence intensity at the periphery of the cell, relative to intracellular fluorescence intensity, has been performed (E and F). From profiles, we determined the sarcolemmal fluorescence intensities S1 and S2 (panel E) and the mean (S) of these two values was divided by the minimal fluorescence intensity value (level C in the panel E) found in the profile of panel (E). The determined ratio S/C was calculated from images in WT (n = 11 cells) and mdx (n = 13 cells) cardiomyocytes. (G) Example of western blot obtained from isolated ventricular WT and mdx cardiomyocytes. A two bands (a and b) profile was observed with a marked presence of a light band in mdx sample. (H) The proportion of the two bands was evaluated through the calculation of the ratio of the band densities (a band density/b band density). *** P < 0.001, * P < 0.01.

