
Figure 3.
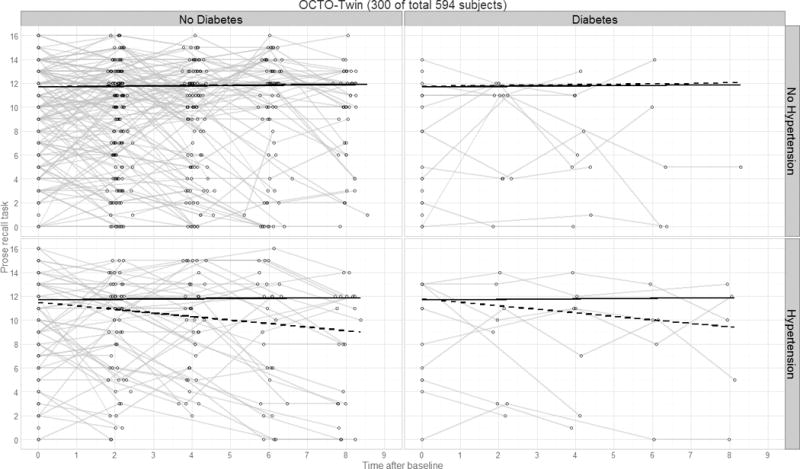
Panel plot illustrating predicted verbal declarative memory performance over time by diagnostics group for the OCTO-Twin study. Thin lines represent raw trajectories for a random sample of participants (total N=300); solid lines represent the fixed effect intercept and slope estimates; dashed lines represent the main effect intercept and slope estimates.