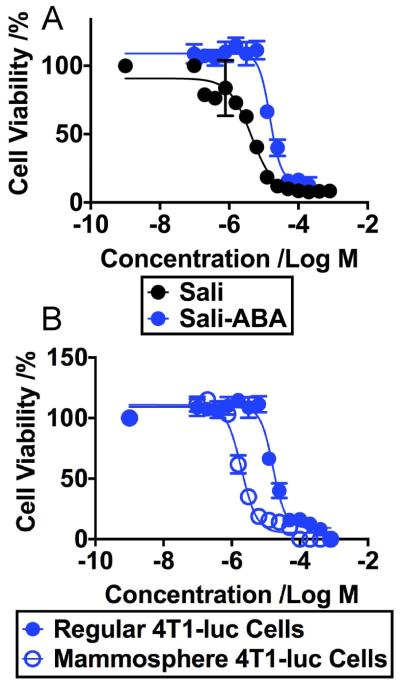
Figure 2.
A. The viability profile of regular 4T1-luc cells after they were exposed to different concentrations of Sali or Sali-ABA for 72 hours. The IC50 values of Sali and the Sali-ABA are statistically different (P< 0.0001, t-test). B. The viability profile of regular 4T1-luc cells versus mammosphere 4T1-luc cells after they were exposed to different concentrations of Sali-ABA for 72 hours. The IC50 values of Sali-ABA in regular 4T1–luc and mammosphere 4T1-luc are statistically different (P<0.0001 t-test).

