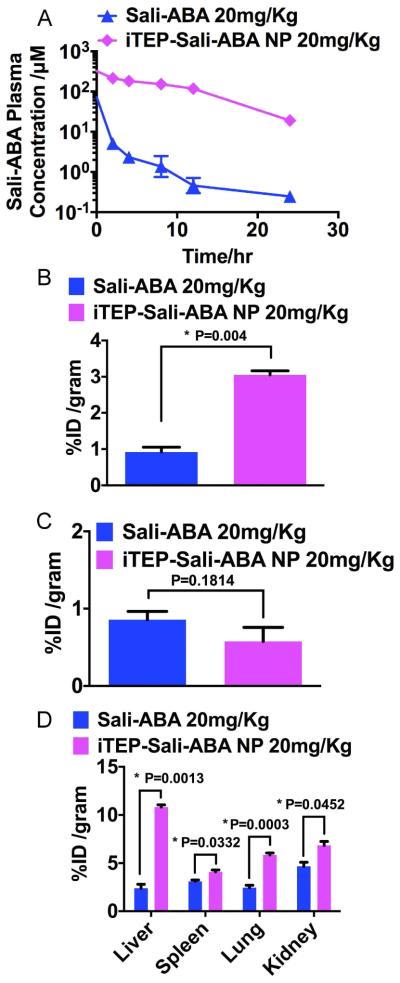
Figure 4.
A. Plasma concentration of Sali-ABA after it was administered in its free form or iTEP-Sali-ABA NP. B. Tumor accumulation of Sali-ABA after it was administered at 20 mg/kg dose (same below). Tumors and all following organ samples were collected at 24 hours post administration. The quantities of Sali-ABA were expressed as percentage of initial dose normalized by weight of organs, ID% /gram. The data were analyzed by one-way ANOVA. P-value is shown in the figure and * indicates a significant difference. C. Heart accumulation of Sali-ABA. The data were analyzed by one-way ANOVA. P-value is shown in the figure. D. The accumulation of Sali-ABA in livers, spleens, lungs, and kidneys. The data were analyzed by one-way ANOVA. P-values are shown in the figure and * indicates a significant difference.

