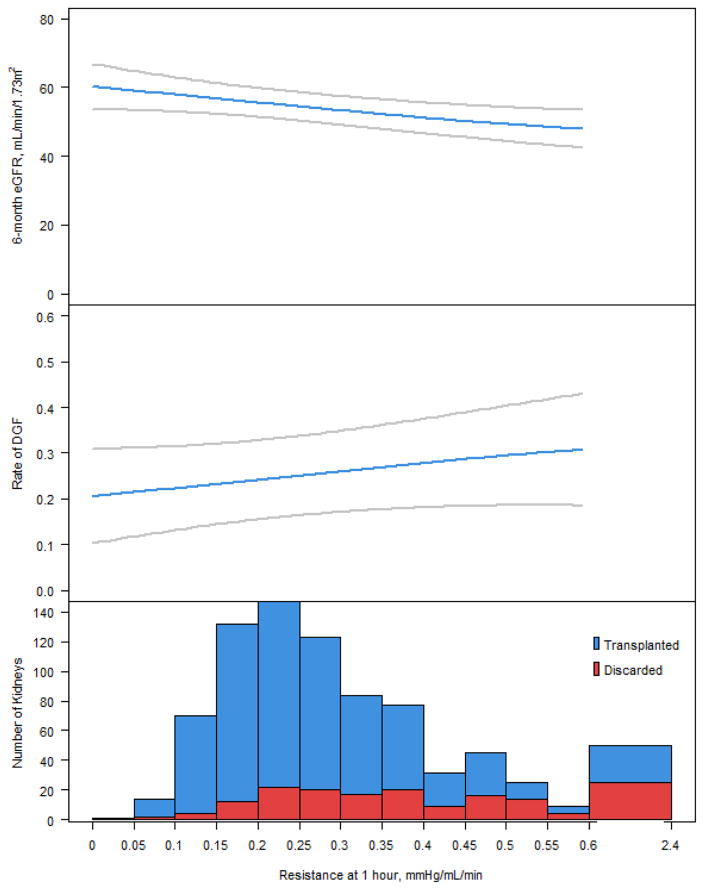
Figure 4.
Association of 6-month eGFR and DGF with deciles of renal resistance at 1 hour and proportion of discarded kidneys.
Upper panel: Smoothed curve depicting relationship of 6-month estimated glomerular filtration rate (eGFR) to renal resistance, estimated from a generalized additive model with multivariable adjustments; categorical adjustments are fixed at the most common value, and continuous adjustments are fixed at the cohort average. Middle panel: Smoothed curve depicting relationship of delayed graft function (DGF) to renal resistance, estimated from a generalized additive model with multivariable adjustments as above. Lower panel: histogram of renal resistance values, categorized by discard status.

