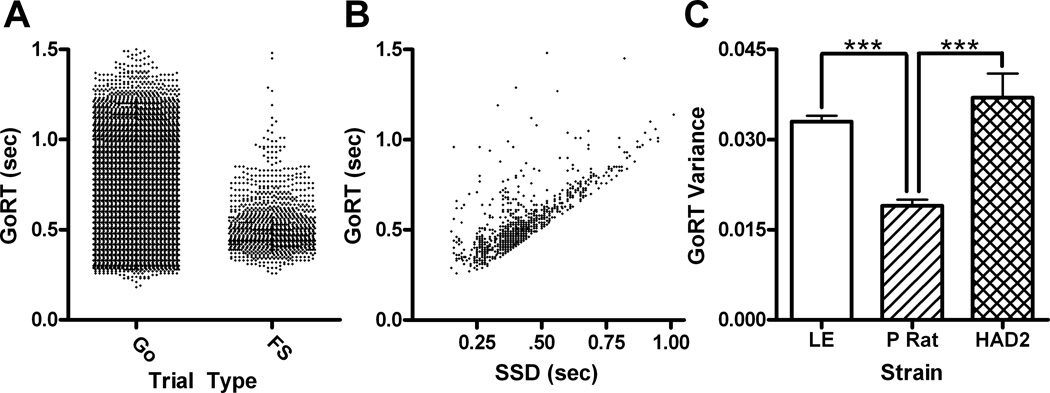
Fig. 1.
Go reaction times (GoRT) from the SSRT task. A) GoRT collapsed across strain and plotted based on trial type (Go versus failed stop; FS). B) GoRT on failed stop trials plotted as a function of SSD. C) Mean (±SEM) variance in GoRT per session graphed as a function of strain. *** P<.001 using Fischer’s LSD test.

