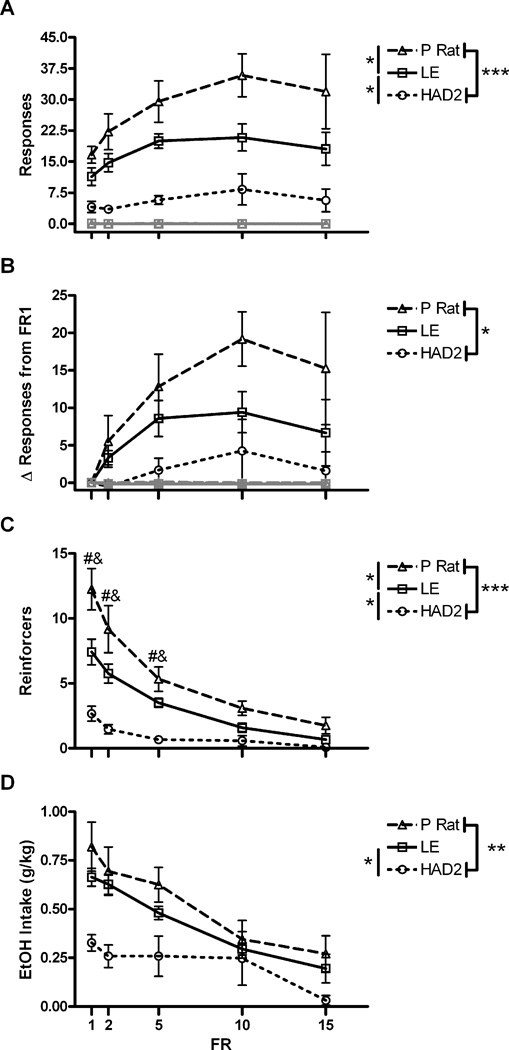
Fig. 4.
Operant alcohol self-administration as a function of FR and strain. A) Mean (±SEM) responding on both the active (black) and inactive (grey) levers. B) Mean (±SEM) change in responding from responding at an FR1 on the active (black) and inactive (grey) levers. C) Mean (±SEM) number of reinforcer presentations earned. D) Mean (±SEM) intake of 10% EtOH. *, **, and *** correspond to p<.05, p<.01, and p<.001 using Fischer’s LSD test; #, ‡, and & indicate differences between P vs. HAD2, P vs. LE, and LE vs. HAD2 respectively using Student t tests after Bonferroni correction for multiple comparisons.

