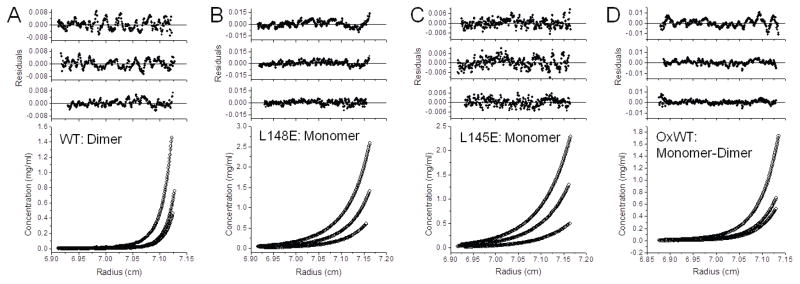
Figure 2. Sedimentation equilibrium analysis of Prdx6.
Proteins in 20 mM Tris, 130 mM NaCl, 0.1 mM EDTA, 5% glycerol, pH 7.4 were centrifuged at 26,200 rpm until equilibrium was achieved; EDTA was not present in the buffer for the experiment described in (A). For all conditions, the lower panel shows the raw data (circles) and the line shows the global ideal fit. The upper panels show the residuals of the fitted curve to the data points for each concentration, highest to lowest, top to bottom, respectively. (A) Wild type Prdx6 was analyzed at three different initial loading concentrations (0.4, 0.2 and 0.1 mg/ml) at 4°C. The best fit for the sample data was a dimer model and no significant monomer was detected under these conditions. These results are consistent with a Kd in the low nanomolar range or less. Prdx6 L148E (B) and Prdx6 L145E (C) were analyzed at three different initial loading concentrations (0.8, 0.4 and 0.2 mg/ml) at 4°C. The data for both were best fit by a monomer model. (D) WT Prdx6 was oxidized by H2O2 and then analyzed at three different initial loading concentrations (0.8, 0.4, and 0.2 mg/ml) at 30°C. The data from this sample was best fit by a monomer-dimer model although a single equilibrium constant for each concentration could not be fitted (0.8 mg/ml, Kd ~ 0.8 μM; 0.4 mg/ml, Kd ~ 0.07 μM; and 0.2 mg/ml, no monomer was detected). The inability to fit a single Kd at all concentrations indicates a non-ideal equilibrium.

