
Figure 3.
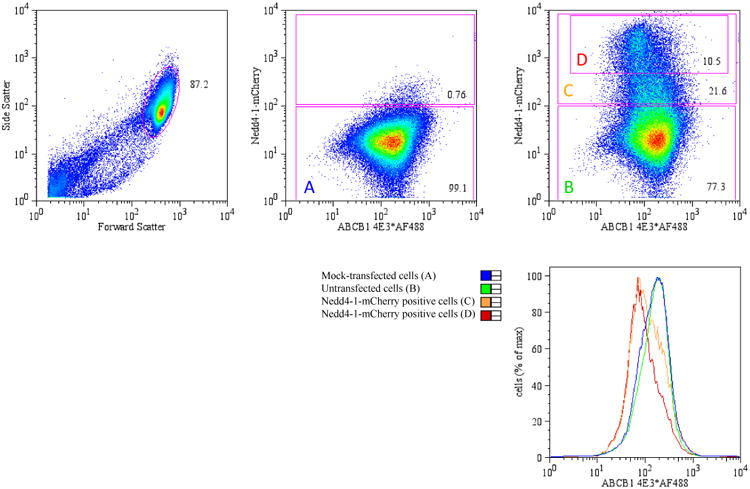
Flow cytometric analysis of ABCB1 in the plasma membrane of Flp-In-ABCB1-12His cells. Left dotplot, cells were gated for normal size and granularity (the same gate was used for populations); Middle dotplot, two colour analysis of mock-transfected cells; Right dotplot, two colour analysis of cells transfected transiently with pcDNA3-NEDD4-1-mCherry. Each dot represents a single cell and the density of cells is colour coded from blue (few cells) to red (many cells). The numbers represent the percentage of cells in a given gate, and the coloured letters define the analytical gates used to plot the histogram. The histogram shows ABCB1 expression in NEDD4-1-expressing (orange and red) and non-expressing cells (blue and green). Histogram colour coding is consistent with the lettering in the dotplots.