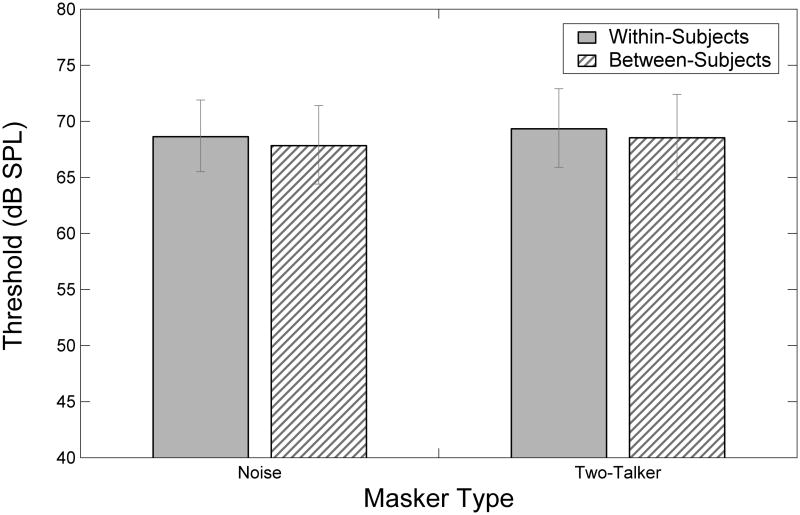
Figure 3.
Group average speech detection thresholds (in dB SPL) are shown for seven infants tested in the speech-shaped noise masker (filled bars) and six different infants tested in the two-talker speech masker (open bars). Data for the seven infants tested in both masker conditions are re-plotted from Figure 1. Error bars represent plus or minus one standard error of the mean.

