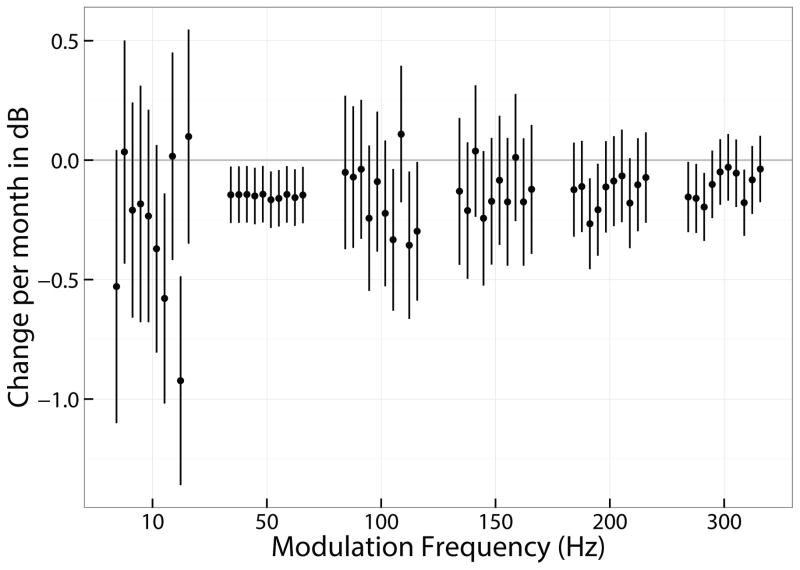
Figure 8.
Shows the mean and 95% confidence intervals of the slopes of temporal modulation performance over time for all 10 listeners for all frequencies of modulation. Data are based on the output of a linear mixed models to the longitudinal data for each condition in which the individual listeners’ performances were a random effect.

