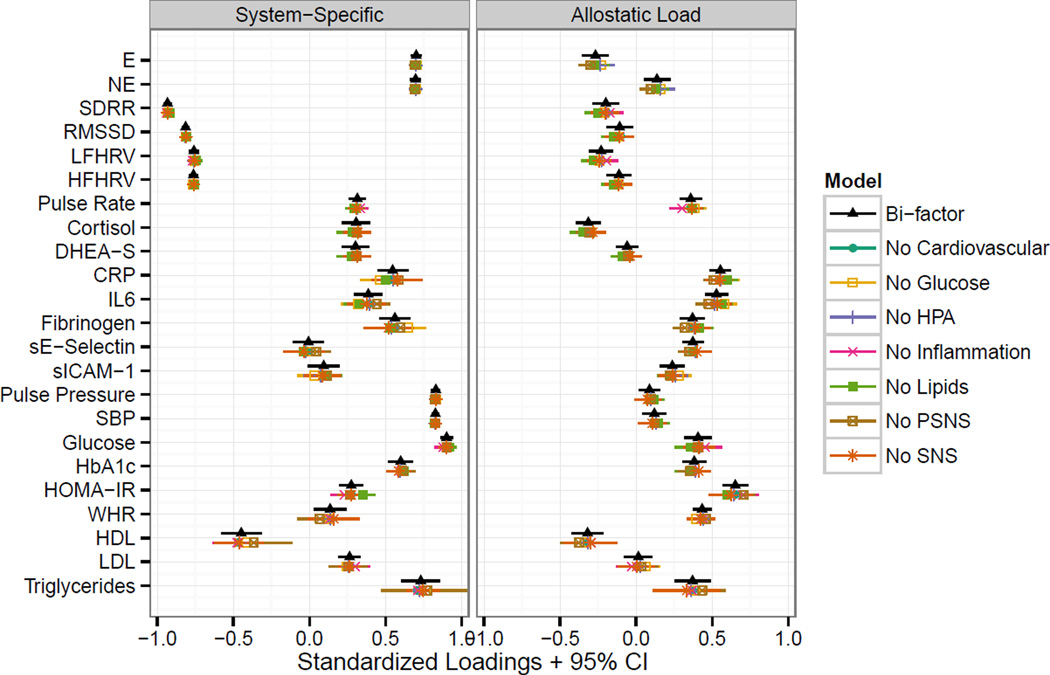
Figure 3.
Item Parameter Invariance Plot. Standardized loadings with 95% confidence intervals for the overall bi-factor model are shown in black triangles. Results from seven “reduced” models where each system was systematically dropped are shown slightly below the results from the overall bi-factor model. The overlap in points and confidence intervals shows that the standardized loadings for the remaining biomarkers do not change substantially when biomarkers for any one system are dropped.

