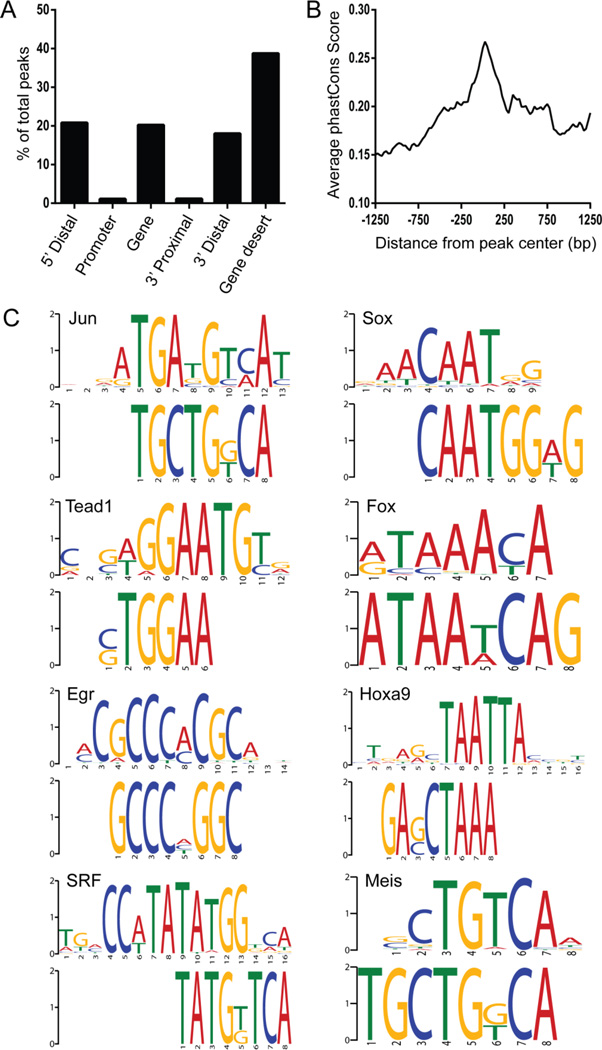
Figure 4. Characterization of genomic regions bound by c-JUN in E14.5 intestine.
(A) Distribution of peaks relative to the nearest transcription start site (TSS) or transcription end site (TES) of the closest gene. Location of the peak is categorized as within a gene if it is between the TSS and TES, gene desert if it is greater than 100 Kbp from the gene, 5’ distal if it is between 100 Kbp and 2 Kbp upstream of the TSS, promoter if it is ≤2 Kbp upstream of the TSS, 3’ proximal if it is ≤2 Kbp downstream of the TES or 3’ distal if it is between 2 Kbp and 100 Kbp from the TES. (B) Average vertebrate phastCons score for each nucleotide position mapped from the center of the peak. (C) Motif enrichment analysis (DREME) of the central 100 bps of the peaks identified several transcriptional factors involved in muscle development. Top ranking motifs have the following corrected E-values: Jun (4.20E-23), Sox (1.40E-43), Tead1 (1.10E-37), Fox (1.40E-29), Egr2 (5.00E-31), HoxA9 (1.40E-23), SRF (4.00E-14) and Meis (1.50E-12).

