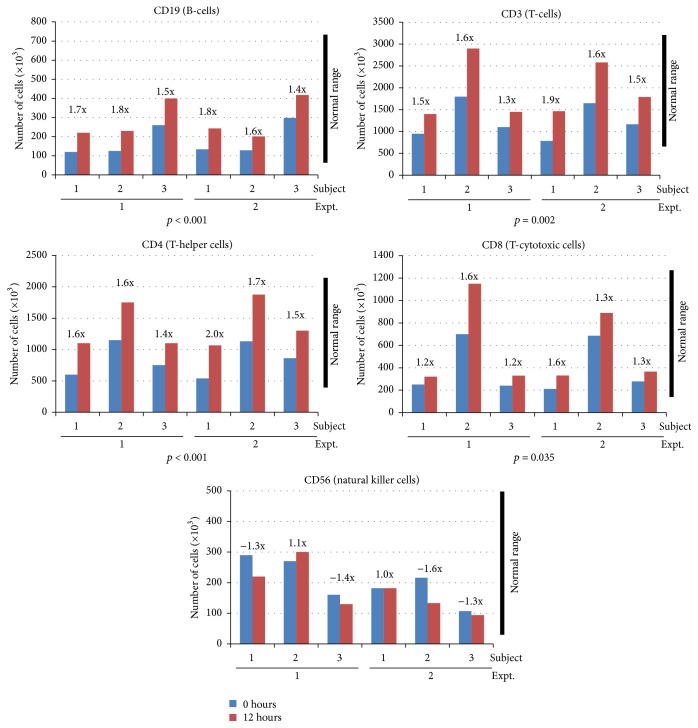
Figure 2.
AM effect on lymphocyte subset populations. Subjects (1, 2, or 3) were administered AM at a 1.5 mL extract/kg body weight dose. Blood draws were performed 0 (blue bars) and 12 (red bars) hours after administration and lymphocyte subset cell populations were measured. The experiment was repeated twice. Peak fold changes relative to baseline (t = 0 hours) are indicated. Normal physiological ranges of the different cell populations are indicated by black bars.

