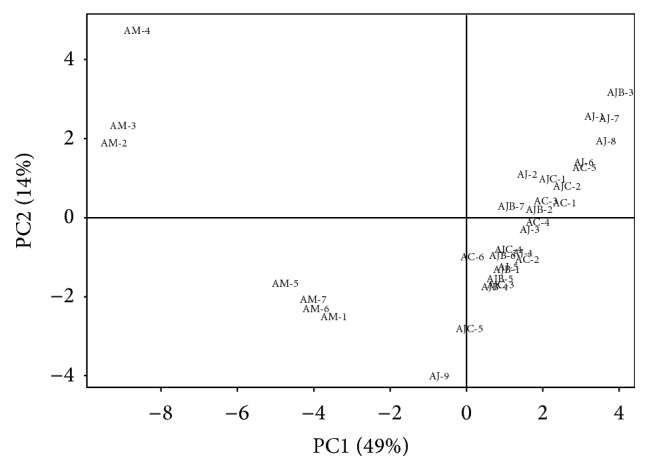
Figure 5.

Score plot of principal components (PC1 versus PC2) on the variables (absolute area of reference peaks) with Atractylodes samples. PC1 and PC2 represent 49% and 14% of the total variance, respectively. AC: A. chinensis Koidz.; AJ, AJB, and AJC: A. japonica Koidz.; AM: A. macrocephala Koidz.
