
Fig. 3.
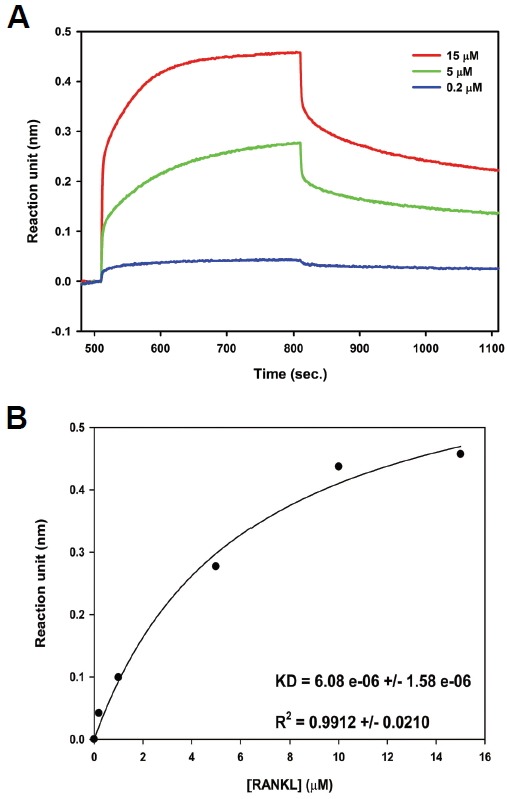
L3-3B binding affinity for RANKL. (A) Diagram of binding between RANKL and L3-3B as determined by biolayer interferometry. (B) Steady-state analysis of the binding affinity between L3-3B and RANKL; f = Bmax * abs(x) / (Kd + abs(x)) was used for the fit-curve analysis.