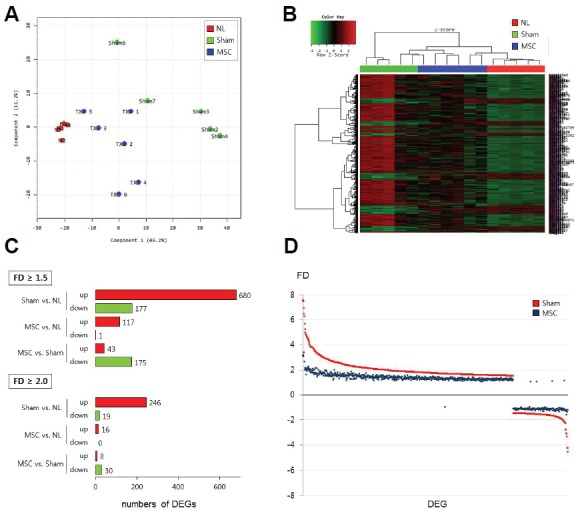
Fig. 1.

Genomic profiling in the rat brain after cerebral ischemia and IV-MSC treatment. (A) 2D-multidimensional scaling (MDS) plot in the normal (NL group, red circles), MCAo (sham group, green circles), and IV-MSC (MSC group, blue circles) rats. (B) Heat-map of differentially expressed genes (DEGs) in the normal (NL), sham, and MSC groups. (C) Numbers of DEGs according to the threshold of fold difference (FD ≥ 1.5 or FD ≥ 2.0) in expressions between the normal (NL), sham, and MSC groups. (D) Dot-plot showing the FD of the expression of individual DEGs (n = 857) in the sham (red dots) and MSC (dark-blue dots) groups compared to the normal group.
