Fig. 2.

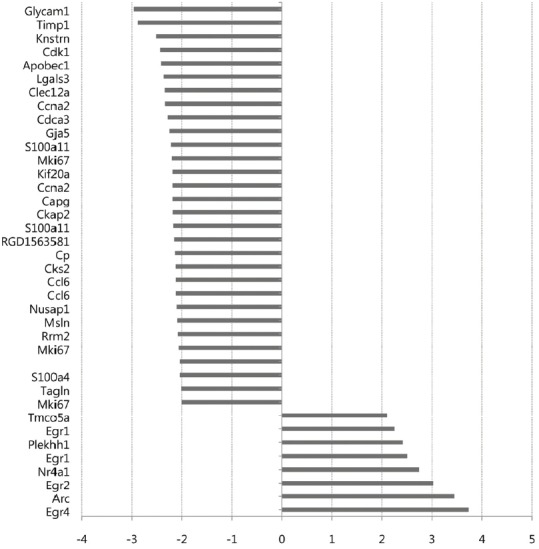
List of DEGs with FD ≥ 2 between the sham and MSC groups. The x-axis represents the relative FD of gene expression between the MSC and sham groups. The full name of individual genes are described in Supplementary Table S2.

List of DEGs with FD ≥ 2 between the sham and MSC groups. The x-axis represents the relative FD of gene expression between the MSC and sham groups. The full name of individual genes are described in Supplementary Table S2.