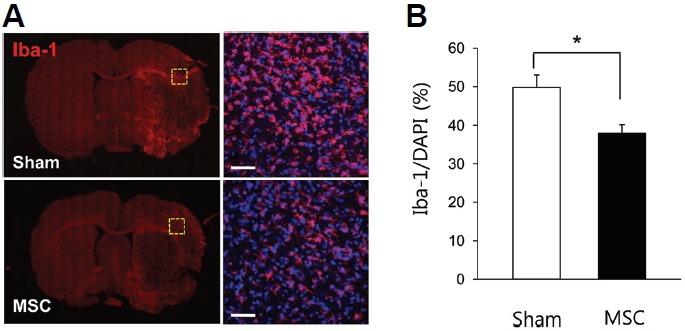
Fig. 3.

Microglial activation changes in the postischemic brain after IV-MSC in MCAo rats. (A) Confocal microscopy for Iba-1 immunohistochemistry in brain sections from the sham (n = 4) and MSC (n = 4) groups. The right panel represents the brain area indicated by the yellow dashed box in the left panel. Scale bar, 20 μm. A nuclear marker, 4′, 6-diamidine-29-phenylindole dihydrochloride (DAPI, blue color) was used for counterstaining. (B) Graph showing the percentage of Iba-1+ to DAPI+ cells in the peri-infarct area of brains of the sham and MSC groups. *p < 0.05 with Mann-Whitney U test.
