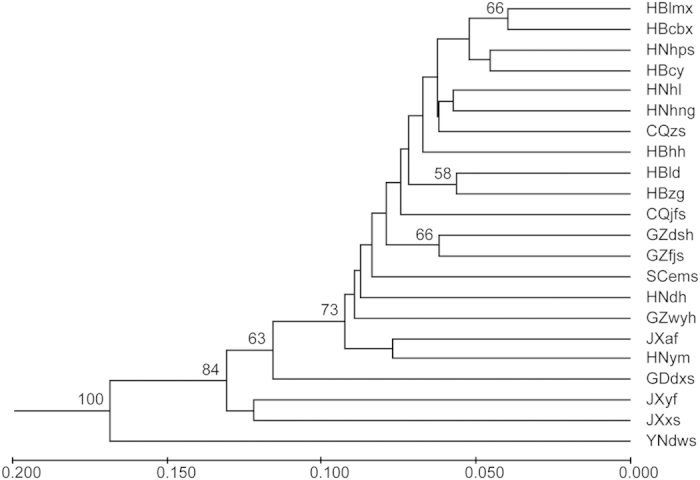
Figure 1. UPGMA dendrogram among 22 populations of C. oliveri was constructed based on Nei’s unbiased genetic distances.

Bootstrap values larger than 50% were displayed above branches (% of 1000 replicates). Scale between branch lengths and genetic distances was shown at the bottom of figure.
