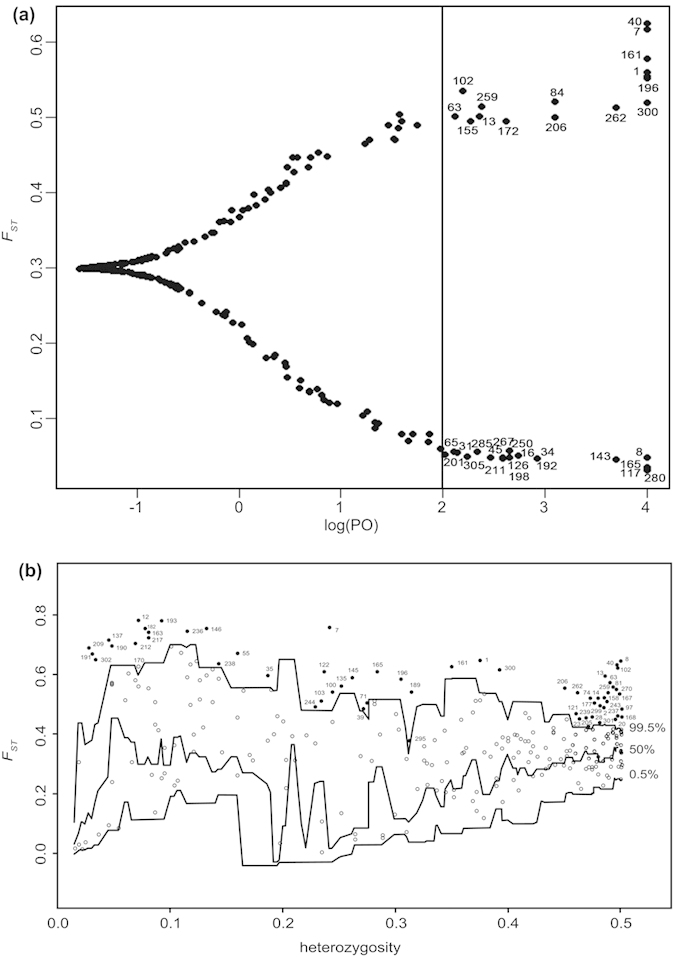
Figure 3. Outlier loci identified by Bayescan and Dfdist.

(a) Plot of FST values and log10PO for 310 loci identified using Bayescan. Lines log10PO = 2 indicate “decisive” evidence for selection corresponding to a posterior probability of 0.99. Solid black dots greater than log10PO 2 represented outlier loci. (b) Outlier detection performed with Dfdist. Plot of FST values of 310 loci in C. oliveri populations was against heterozygosity. The 0.5%, 50%, and 99.5% represented confidence intervals, respectively. Loci above the 99.5% line were designated as outlier loci.
