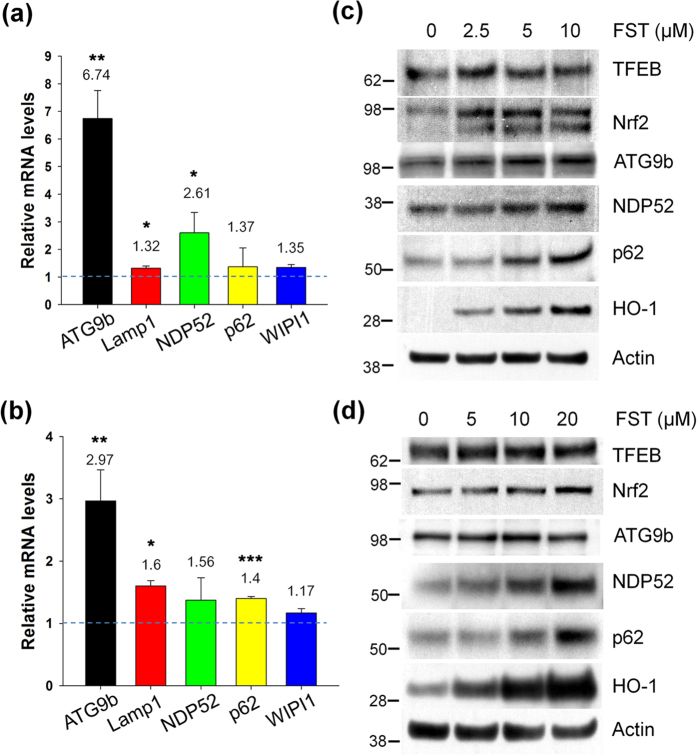
Figure 6. Fisetin induces autophagy and lysosomal genes.
(a,b) Mouse cortical cells (T4) and rat primary cortical neurons were treated with 5 and 10 μM fisetin for 24 h, respectively. Quantitative real time PCR (qRT-PCR) was performed using primer sets of genes of interest following the procedure described in Methods. Bar graphs represent the relative mRNA level of genes in T4 cells (a) and neurons (b) compared to those in cells not treated with fisetin. (c,d) T4 cells and neurons were treated with fisetin (FST) for 24 h and 36 h, respectively. The levels of TFEB, Nrf2, ATG9b, NDP52, p62/SQSTM1 and HO-1 in T4 cells (c) and neurons (d) were analyzed by immunoblotting using each corresponding antibody, respectively. Data shown are mean ± SE of three independent experiments and were analyzed using Student’s t test. (*p < 0.05; **p < 0.01; ***p < 0.001).

