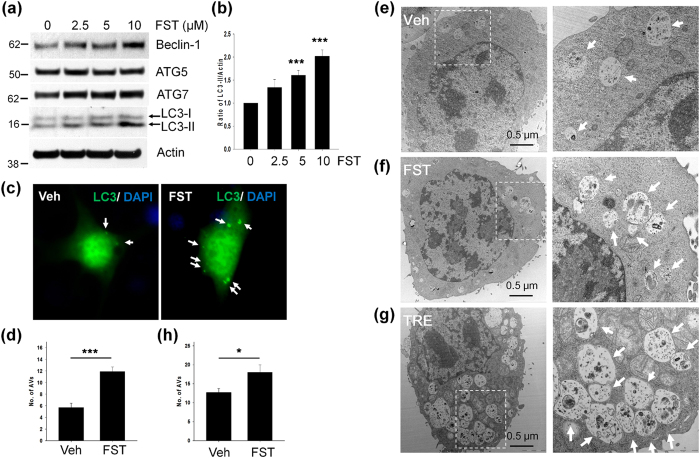
Figure 7. Fisetin activates autophagy.
Mouse cortical neuronal cells (T4) were maintained in the presence of doxycycline (1 μg/ml) to induce the expression of tau for 12 h, and subsequently treated with different concentrations of fisetin (FST) for 24 h. (a) The levels of beclin-1, ATG5, ATG7 and LC3-II were analyzed by immunoblotting using the anti-beclin-1, ATG5, ATG7 and LC3 antibodies, respectively. (b) Bar graphs represent the relative ratio of LC3-II normalized with that of actin. (c) The cells transiently transfected with GFP-LC3 were treated with 5 μM FST for 24 h, and observed using an epifluorescence microscope. Arrows indicated autophagic vesicles (AVs). (d) Bar graph represents the number of AVs per cell in about 15 cells randomly chosen. (e–h) T4 cells were treated with either DMSO (Veh) (e), 5 μM fisetin (FST) (f) or 100 mM trehalose (TRE) (g). (e–g) The cell images were taken with transmission electron microscope (TEM). Dotted lines in left panel represent the enlarged area for images on the right, respectively. (h) Bar graph represents the number of AVs per cell in approximately 10 cells observed under transmission electron microscope (TEM). Arrows indicate autophagic vesicles (AVs). Data shown are mean ± SE of three independent experiments and were analyzed using Student’s t test. (*p < 0.05; ***p < 0.001).

