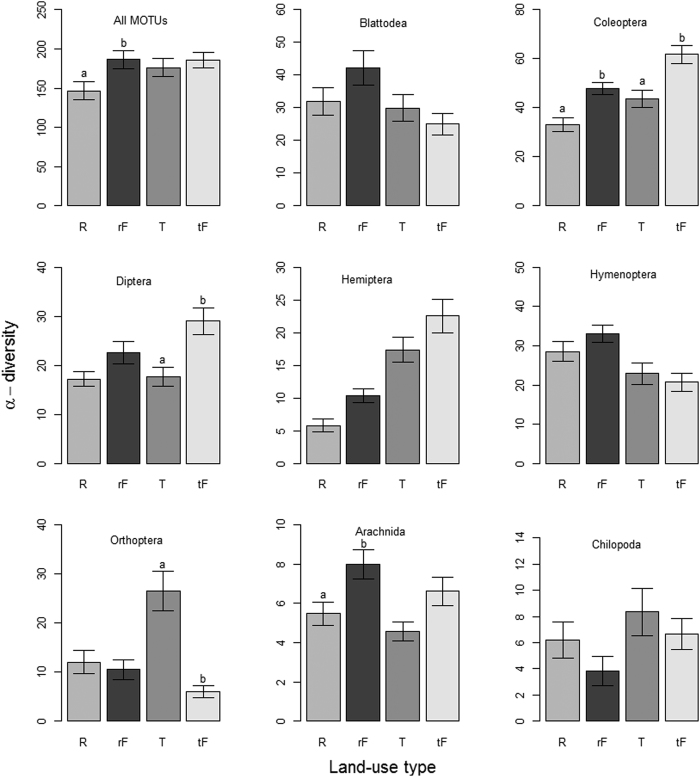
Figure 2. Comparison of α-diversity (mean ± s.e.m.) in matched forest-plantation sites for all MOTUs and eight arthropod orders.
All tests are based on Kruskal–Wallis followed by Mann–Whitney post-hoc comparisons with Bonferroni correction. Significant differences between pairs [R vs. rF and T vs tF] are indicated with different lowercase characters (a, b). R = rubber, T = tea, while rF and tF = forest matched with rubber and tea, respectively.

