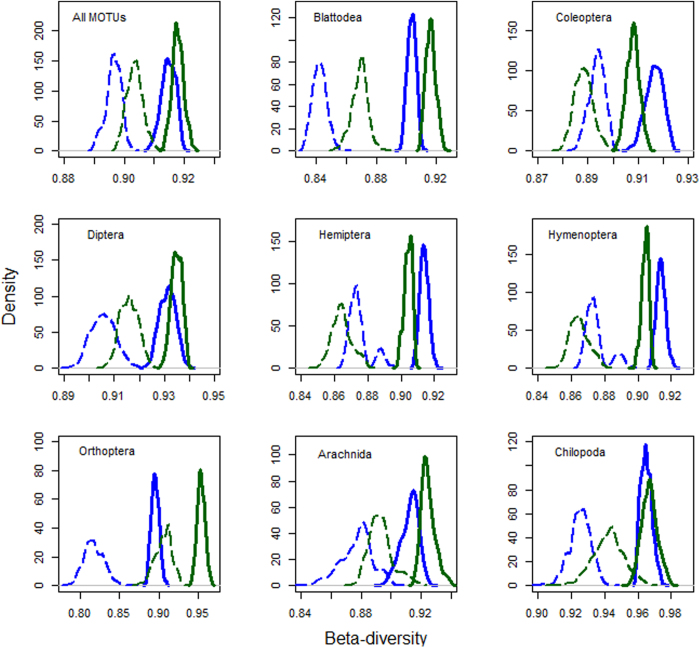
Figure 4. Total β-diversity (smooth lines) and turnover (broken lines) for tea-forests [green lines] versus tea [blue lines] sites.
These were computed using 1000 bootstrap samples of 15 sites from each land use type. Significant differences between pairs are detected when the peaks of the density plots do not overlap with each other.

