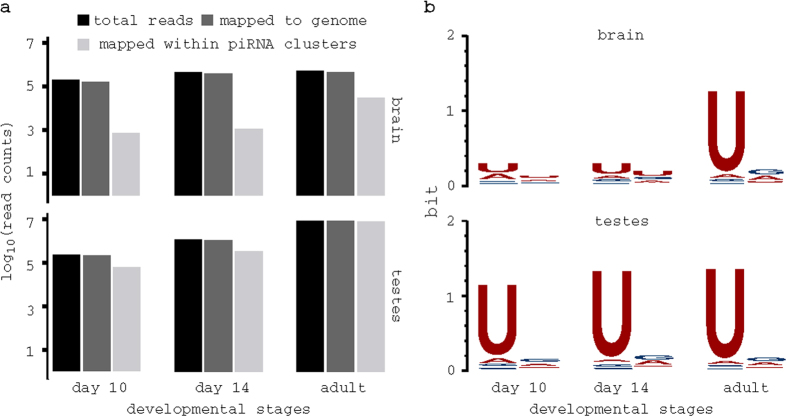
Figure 1. Sequencing of piRNA in brain and testes.
(a) Bar plot shows the number of sequenced reads; reads that mapped to genome; and reads mapped within annotated piRNA clusters. (b) Sequence bias of reads obtained in each stage and tissue; unlike reads at adult stage in brain, reads at 10 dpp and 14 dpp lack significant 1U bias, all reads from testes samples showed significant 1U bias. Sequence logo was obtained using Weblogo68.

