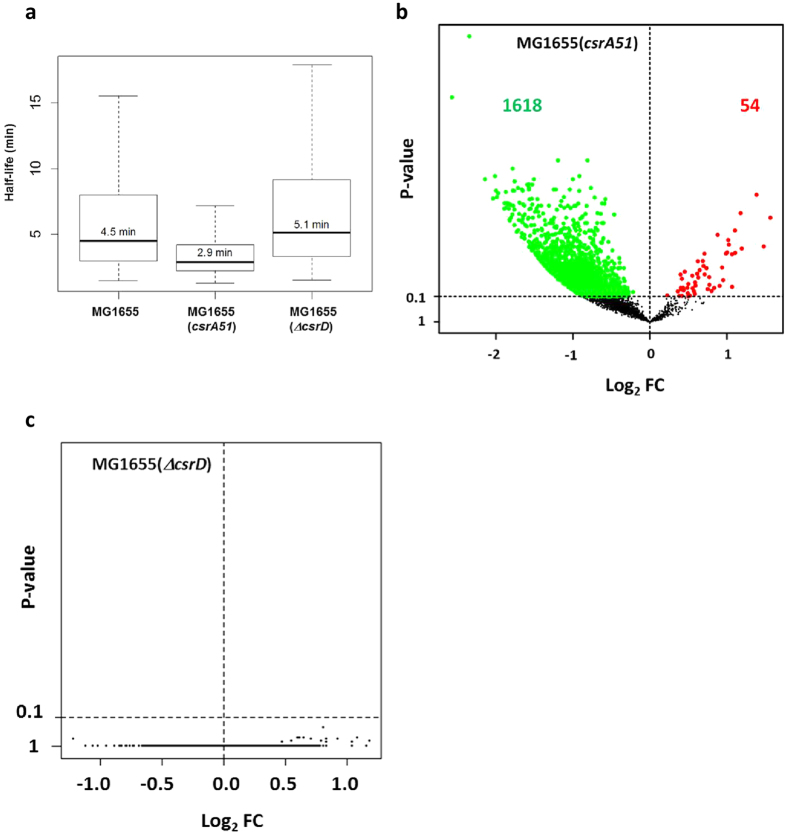
Figure 2. Effect of the csrA51 and ΔcsrD mutations on mRNA half-life.
(a) Box plots of transcript half-life for the MG1655, MG1655(csrA51) and MG1655(ΔcsrD) strains (n = 3351 mRNAs). Values are separated into four quartiles by horizontal bars. The central bar (in the middle of the rectangle) represents the median value, which is given above the bar. VolcanoPlot of the log2 fold change (Log2 FC) of mRNA half-lives (b) between the MG1655(csrA51) and MG1655 strains (n = 3028 mRNAs) and (c) between the MG1655(ΔcsrD) and MG1655 strains (n = 3333 mRNAs). A P-value ≤ 0.1 was required for fold change significance (above the horizontal dashed line). The significantly stabilized mRNAs in the mutant strain compared to the MG1655 strain are colored in red whereas the significantly destabilized mRNAs are colored in green.

