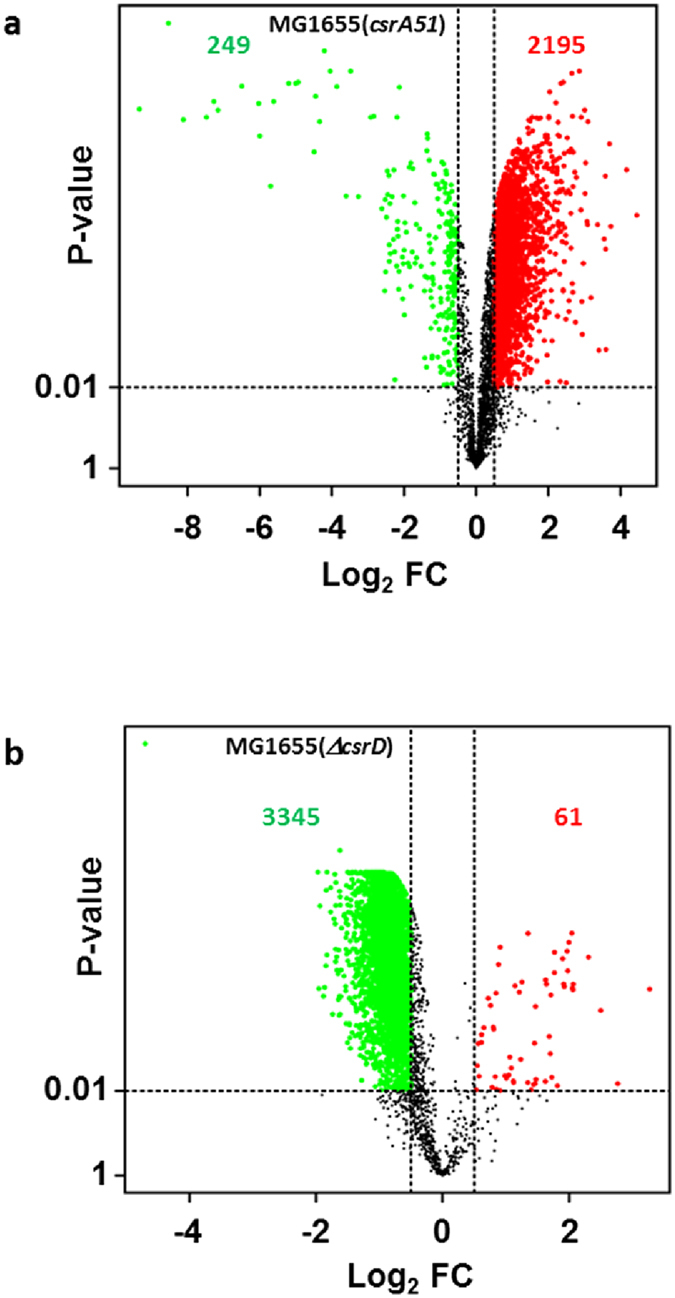
Figure 4. Effect of the csrA51 and ΔcsrD mutations on mRNA levels.

VolcanoPlot of the log2 fold change (Log2 FC) of mRNA amounts (n = 4254 mRNAs) (a) between the MG1655(csrA51) and MG1655 strains and (b) between the MG1655(ΔcsrD) and MG1655 strains. A P-value ≤ 0.01 (above the horizontal dashed line) and a log2 FC higher than 0.5 or lower than −0.5 (outside the vertical dashed lines) were required for fold change significance. Between the mutant strain and the MG1655 strain, the significantly up-regulated amounts were colored in red whereas the significantly down-regulated levels were colored in green.
