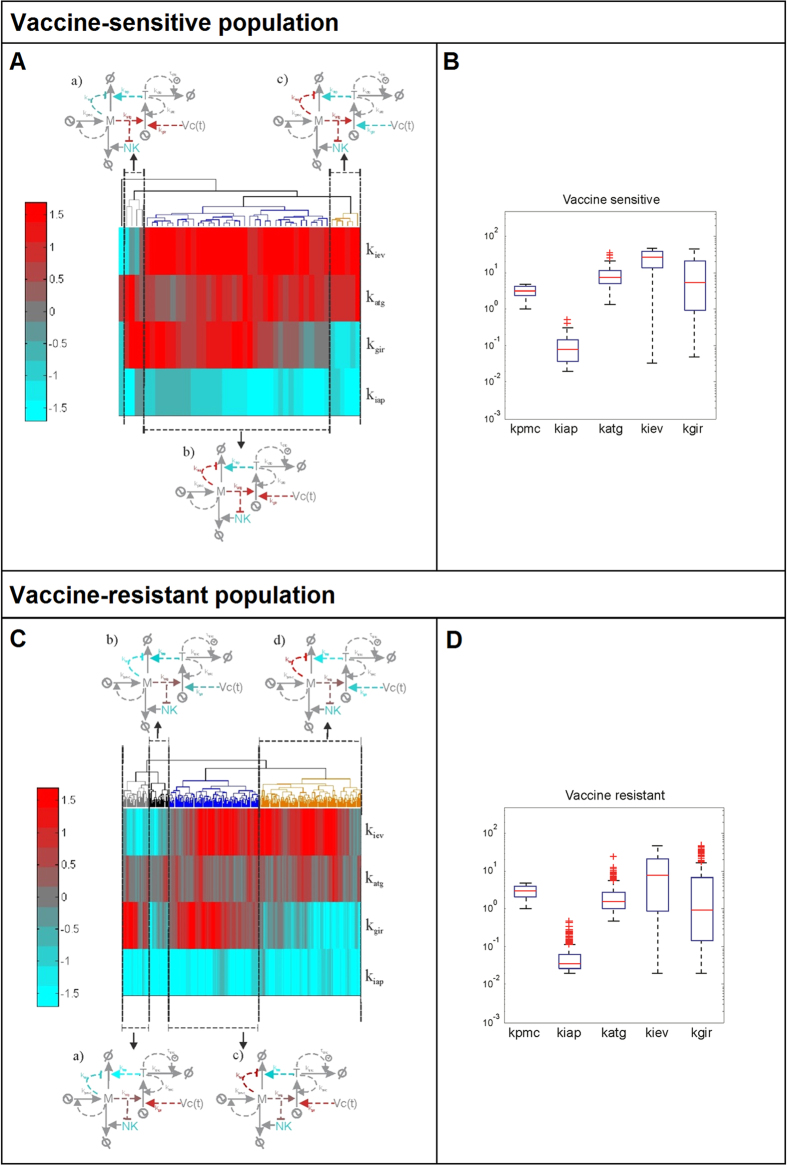
Figure 4. Phenotypic signatures for the subpopulations of vaccine-sensitive (top) and vaccine-resistant (bottom) solutions.
Log10 of the nominal parameters in Supplementary Table 1 value is shown (A,C). Hierarchical clustering of the solutions in each population with dendrograms and sketches of the regulatory pattern they elicit (B,D). Original overall phenotypic signature for each population of solutions.

