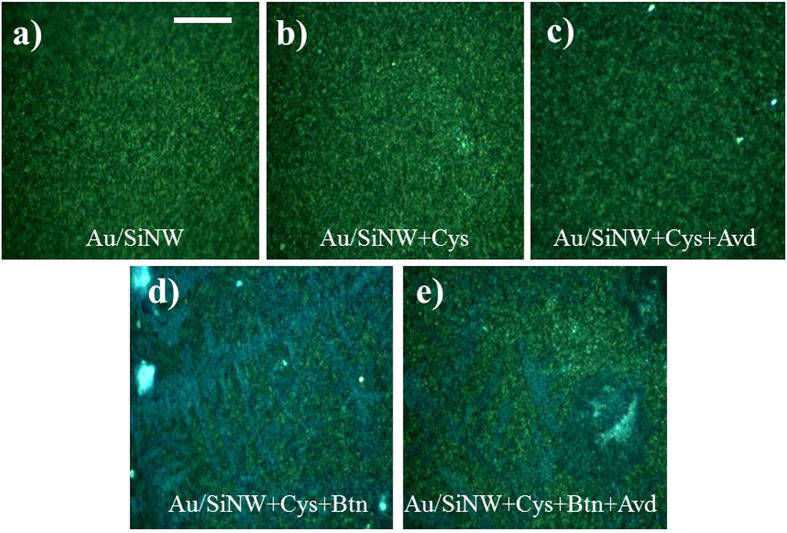
Figure 3.
Optical images obtained on the sample at different stages of the functionalization process: the pristine Au/SiNWs (a); treated with cysteamine (Au/SiNWs+Cys) (b); after NHS-biotin binding (Au/SiNWs+Cys+Btn) (d); finally after the immersion in solution with 1 μM content of avidin (Au/SiNWs+Cys+Btn+Avd) (e). The image obtained after control experiment: Au/SiNWs modified with sole cysteamine and after exposure to 1 μM content of avidin solution (Au/SiNW+Cyst+Avd) (c). Scale bar is 100 μm.

