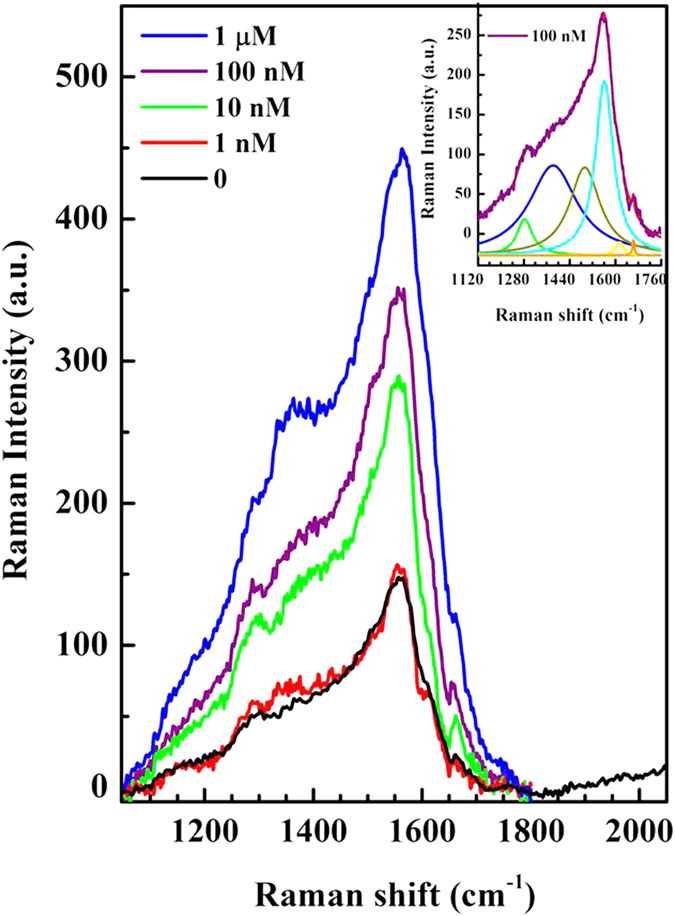
Figure 5. Raman analysis of the biosensor sensitivity.

Spectra collected on identical devices at different avidin concentrations, from 1 μM down to 1 nM. The spectrum before protein adsorption is shown as reference (black line). In the inset the result of the fitting procedure applied to the spectrum collected at 100 nM of avidin concentration. The band ascribed to protein adsorption is centered at about 1380 cm−1 (blue line).
