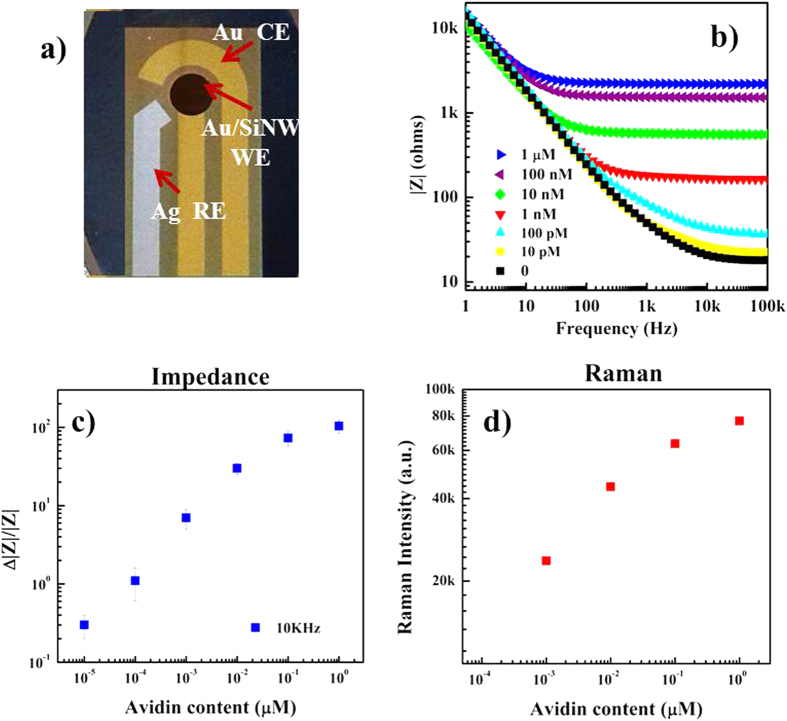
Figure 6.
Photograph of the three-electrode device with Au/SiNW used WE and Raman probe (a). Bode plots of the impedance modulus, |Z|, for the biotin modified Au/SiNWs after the immersion in avidin solution with different concentration ranging from 10 pM up to 1 μM (b). Dependence of impedance variation,  , on the avidin concentration obtained at the frequency of 10 KHz. The values correspond to the average measurements performed on a minimum of three samples, identically treated. The relative standard deviation is indicated by the error bars (c). Intensity of the Raman band at about 1380 cm−1 ascribed to the binding of avidin on the biosensor surface, tuned as for the impedance measurements. The reported values represent the band area obtained by means of a fitting procedure applied to the collected spectra (d).

