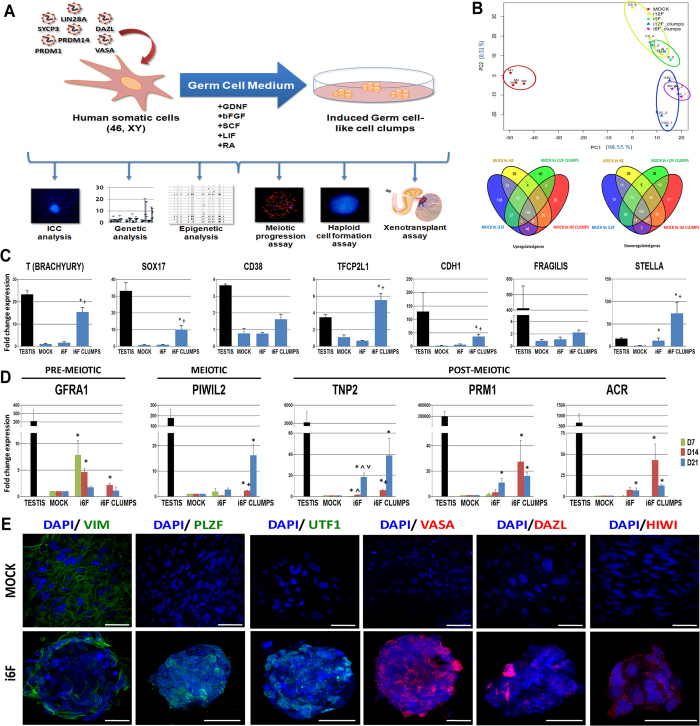
Figure 1. Characterization of induced fibroblasts (hFSKs).
(A) Schematic diagram of the experimental setup of the study. (B) Principal Component Analyses and Venn diagrams of up- and down-regulated genes when compared MOCK, i12F and i6F- induced hFSKs all together (n = 5). (C) RT-qPCR expression analysis of human PGC markers over i6F induced hFSK cells. (D) RT-qPCR expression analysis of the germ line markers GFRA1, PIWIL2, TNP2, PRM1, and ACR over i6F induced hFSK cells at 7 (D7), 14 (14D) and 21 (21D) days post-transduction (n = 8). Human testis cDNA physiological expression fold change relative to MOCK samples is also shown as a control. (E) Illustrative pictures of immunofluorescencent stainings for VIM, PLZF, UTF1, VASA, DAZL and HIWI over MOCK and i6F clumps from hFSK cells. Data is presented as normalized fold change mean +/− SEM. (*) represent significant differences (p < 0.05) with MOCK controls; (+) represents significant differences (p < 0.05) between i12F/i6F conditions and their respective clumps; (∧) represent significant differences (p < 0.05) with day 7 expression within sample groups; (∨) represent significant differences (p < 0.05) with day 14 expression within sample groups. Scale bar represents a distance of 50 μm.

